Database Reference
In-Depth Information
glAnCe AnD go VeRSuS DATA
eXPloRATIon
We've explored the use of monitoring (which can also be called glance and
go), specifically for strategic views, and exploration specifically for tactical BI,
but of course there is a large overlap. Strategic views can include exploration,
and tactical views can include monitoring.
It's time to explore the different use cases. “Glance-and-go” BI, which is often
called
monitoring
and is epitomized by colorful indicator icons, has for many
years been the poster child of BI applications. Figure 2-10 shows an example
with colorful indicators that are presented on a scorecard with drill-down and
drill-across capabilities.
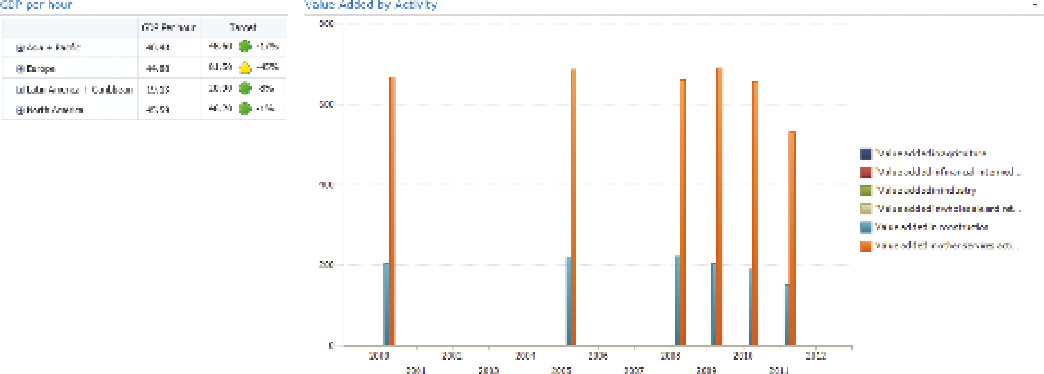
FIguR e 2-10
An interactive scorecard, with indicators. Clicking on an indicator will filter the chart on the right.
For a long time the use of vehicle-type gauges and dials, such as those shown
in Figure 2-11, were immensely popular for a long time, but they're luckily
fading into oblivion now. This format that resembled a vehicular dashboard
seemed like an ideal way of showing business information in a manner that
people were familiar with. However, a key failing of these types of dashboards
were that they showed little information. A gauge is designed to show a con-
tinually changing figure, and it is ideal for continual monitoring; information
such as speed, engine revolutions, and oil temperature are measured up to
thousands of times per minute, and keeping an eye on a gauge is a good
mechanism for viewing this velocity of data. However, business rarely changes
this frequently; Indeed, much financial data is only relevant as of the last month
end, and the gauge is a poor representation of this data.