Database Reference
In-Depth Information
mdx FunCTIons For ComPArIng An ITem wITh ITs Peers
Note that this method of comparing the average of children to the maxi-
mum of children is a particular method of banding generally used to indi-
cate inequality in a region. It is typically used in conjunction with a custom
MDX formula to pull the average from the current level to compare an item
with its peers. In MDX (Multidimensional Expressions), the formula to put
in the target would look like the following:
MAX( [DimCountry].[Regions].CurrentMember.Parent.Children ,
[Measures].[MetricValue] )
As this would show a Target even for those members without data, you
may want to wrap it in a statement like so:
IIF( [Measures].[MetricValue] = NULL, NULL,
MAX( [DimCountry].[Regions].CurrentMember.Parent.Children ,
[Measures].[MetricValue] )
)
The equivalent function to do a rank would be like the following:
IIF( [Measures].[MetricValue] = NULL, NULL,
RANK([DimCountry].[Regions].CurrentMember,
ORDER( [DimCountry].[Regions].CurrentMember.Parent.Children ,
[Measures]. [MetricValue] ) )
)
CuSToM INDICATorS IN PErForMANCEPoINT
Custom indicators are relatively easy in PerformancePoint. For this example,
you are going to use them to create conditional formatting, but you could as
easily add your own images.
Working on the workspace created in the previous example, right-click the
PerformancePoint content list and choose New
a
Indicator. Choose Blank
Indicator and then click OK. Leave the defaults of Standard and 3 levels, and
click Finish.
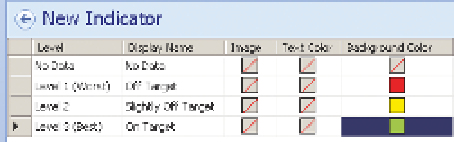
You change the image by double-clicking the red-
lined box, or change the background color by double
clicking. For Level 1 (Worst) click background color,
choose Red from the standard colors, and then click
OK. Set Level 2 as Yellow, and set Level 3 (Best) as
Green. Your indicator setup screen should look like
Figure 10 -19.
FI g u R e 10 -19
Conditional formatting on an indicator