Database Reference
In-Depth Information
Members right-click All, and then choose Autoselect Members
a
Select All
Descendants, as shown in Figure 10-17.
F I g u R e 10 -17
Using auto-select to allow for data changes
Leave the Default member selection blank and click Next. Choose Tree on the
next screen. Name the filter Statistic and save it.
Repeat this process for DimDate.Year, using the member selection filter again,
but only select the years 2000, 2005, 2008, 2009, 2010, and 2011 (which are
the years we have data for). Name the filter Year and save it.
Finish by creating a new dashboard (right-click the PerformancePoint content
list and select New
a
Dashboard). Select 2 Rows and click OK.
Drag the filters to the top row and then drag the score-
card to the bottom row. Connect them as described in
Chapter 7 in the “Filters” section.
Rename your dashboard as
oECD Statistics
, right-click
it, and deploy it to SharePoint. You should have a dash-
board similar to the one shown in Figure 10-18. Not all
data points have data for all years in this data set, so
you may need to work through a few.
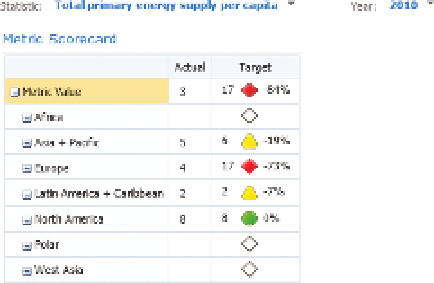
FI gu R e 10 -18
A basic scorecard with filters