Environmental Engineering Reference
In-Depth Information
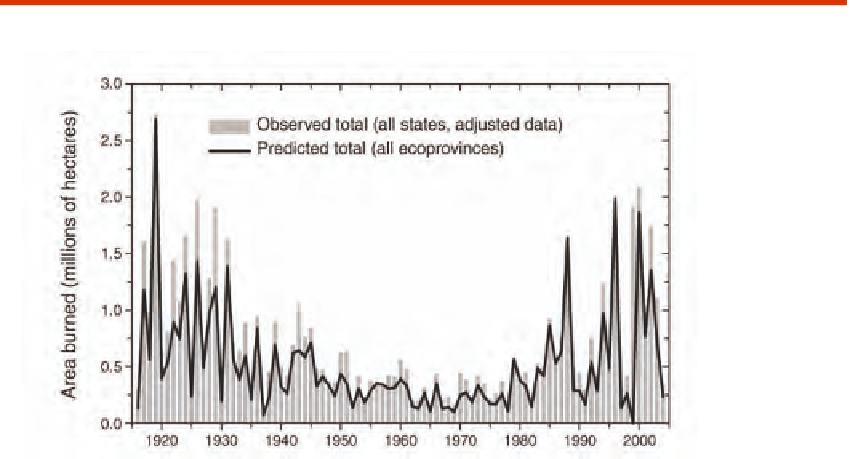
FIGURE 5.6 Observed and reconstructed wildfire area-burned for 11 western U.S. states (bars) and recon-
structed (line) for the period 1916-2004. Source: Littell et al., 2009: Figure 1)
changes will impact wildfires. Shown in Figure 5.7 are the projected changes
in the probability of large (> 200 ha) wildfires in 2070-2090 compared to
the reference period 1961-1990 from one such study (Westerling and Bryant,
2008) that used the output from two of the AR4 climate models (GFDL and
PCM) that were forced with two of the emission scenarios (B1 and A2). There
are two important lessons to be learned from this plot. First, two different cli-
mate models give two very different answers for California: the PCM projects
a subtle change in large wildfires everywhere, while the GFDL model proj-
ects large increases in the probability of large wildfires throughout northern
California. These differences are mainly due to differences in the projected
mean climate: the GFDL model features large temperature increases and
precipitation decreases throughout California, while the PCM has modest
temperature increases and subtle changes in precipitation. Hence, the full
suite of AR4 climate models must be employed to project the probability
of wildfire changes—throughout the globe. Second, although both models
show increasing temperature and decreasing precipitation throughout the
state of California, the likelihood of a large fire
increases
in northern Cali-
fornia (especially in the Sierra) and
decreases
in southern California in both