Environmental Engineering Reference
In-Depth Information
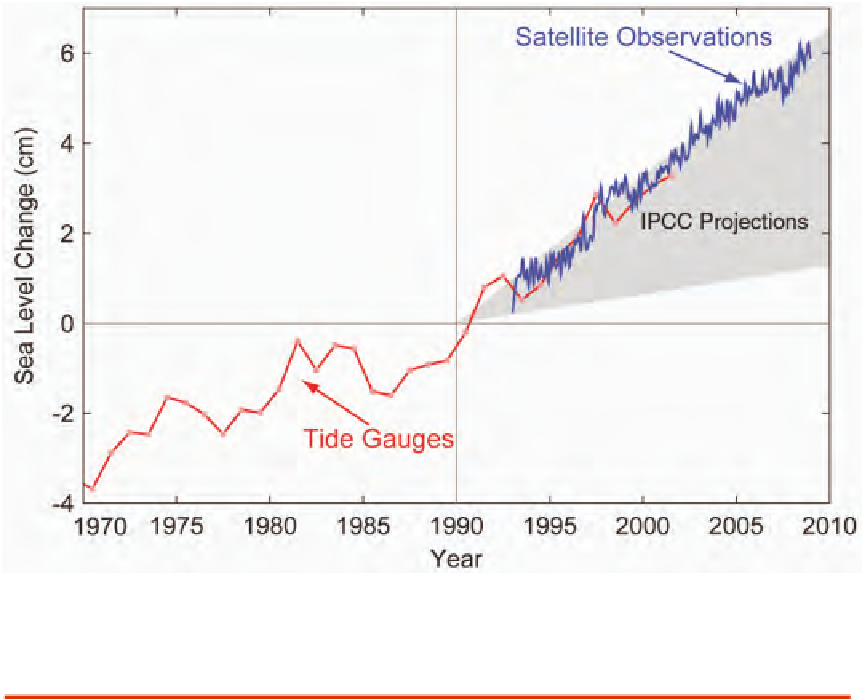
FIGURE 4.20 Sea level change during 1970-2009. The tide gauge data are indicated in red (Church and
White, 2006) and satellite data in blue (Cazenave et al., 2008). The grey band shows the projections of the
IPCC Third Assessment report for comparison.
4-20.eps
Polar Precipitation
Each year, about 8 mm of sea level equivalent accumulates as snow on
Greenland and Antarctica. Small changes in precipitation in polar regions
will have major affects on the mass balance of the Greenland and Antarctic
ice sheets. Increasing temperatures tend to increase evaporation, which leads
to more precipitation. Greenland ice sheet precipitation—downscaled from
ECMWF operational analyses and re-analyses (Hanna et al., 2005)—follows
a significantly increasing trend for 1958-2006. Additional precipitation will
occur due to warmer air temperatures mainly in the form of snow accumula-
tion, therefore largely (i.e., ~80%) off sets rising Greenland run-off over the
same period (Hanna et al., 2008). The increase in precipitation is confirmed
by satellite altimetry data (Johannessen et al., 2005) with a significant growth
of 2-5 cm y
-1
of the Greenland ice sheet interior from 1992-2004.