Environmental Engineering Reference
In-Depth Information
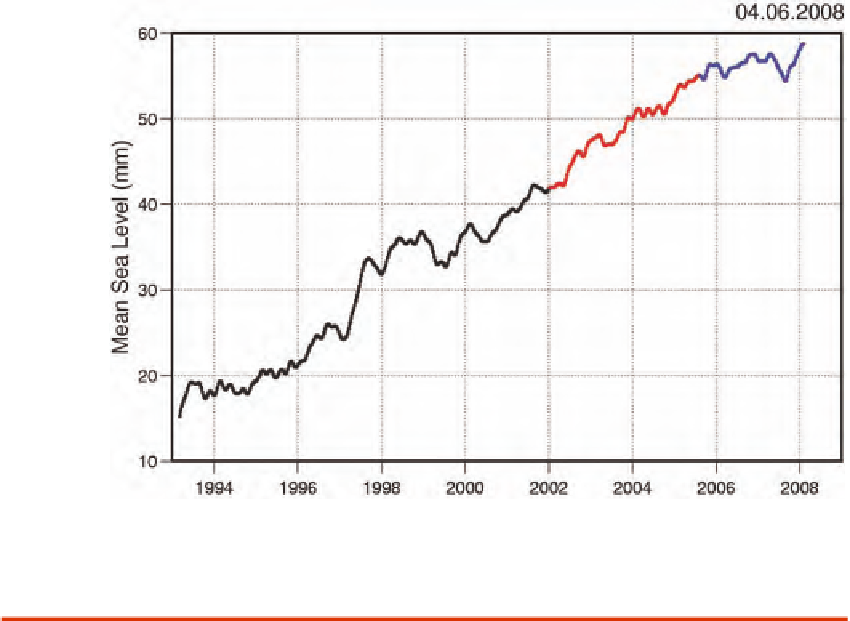
FIGURE 4.21 Sea level curve from Topex/Poseidon and Jason-1 satellite altimetry over 1993-2008 (data
averaged over 65°N and 65°S; 3-month smoothing applied to the raw 10-day data). Black: Topex/Poseidon;
red: Topex/Poseidon plus Jason-1; blue: Jason-1. Source: Cazenave et al. (2008).
The lack of a 20th century trend in net precipitation in recent compre-
hensive analyses over Antarctica is particularly problematic in the context
of 21st century model projections. Almost all climate models simulate a
continuing robust precipitation increase over Antarctica in the coming
century. During the first half of the 21st century, models using the A1B sce-
nario predict anything from a maximum upward trend of 0.71 mm y
-1
to a
maximum downward trend of 0.13 mm y
-1
. Some models project stronger
net precipitation increases in the first half of the 21st century, while other
models project stronger increases after the middle of the century.
Subsidence
Subsidence is the motion of a surface as it shifts downward relative to
a datum such as sea level. Subsidence can be caused by mining, extraction
of natural gas, groundwater-related subsidence, isostatic subsidence (change
in sedimentation rate), just to name a few, and can locally account for sev-