Database Reference
In-Depth Information
To perform another trace, you can click on the eraser icon on the toolbar to
clear all the events and then click on the
Start
button to start a new trace.
4. Clear and restart the trace using the toolbar in the
SQL Server Profiler
. The
Clear Trace Window
button looks like an eraser and the
Start Selected
Trace
button is a green play arrow.
5. Return to Excel and use the clear filter icon in the top-right corner of the
Cal-
endarYear
slicer to release the filter and include all the years.
6. Return to the
SQL Server Profiler
and watch the query trace run.
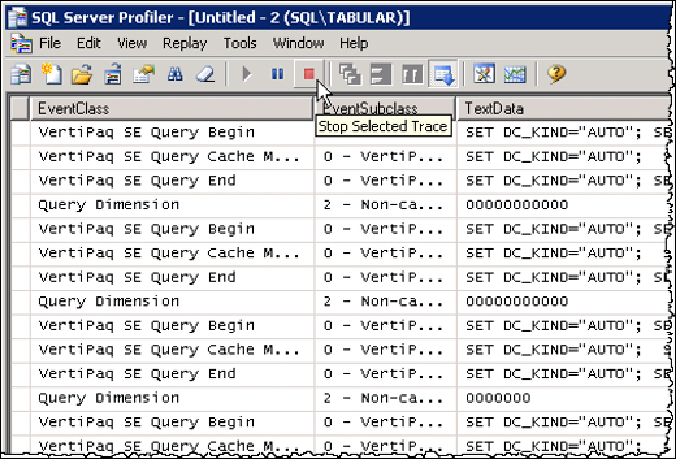
7. When the
Query End
event is captured, stop the trace as shown in the fol-
lowing screenshot:
Search WWH ::

Custom Search