Civil Engineering Reference
In-Depth Information
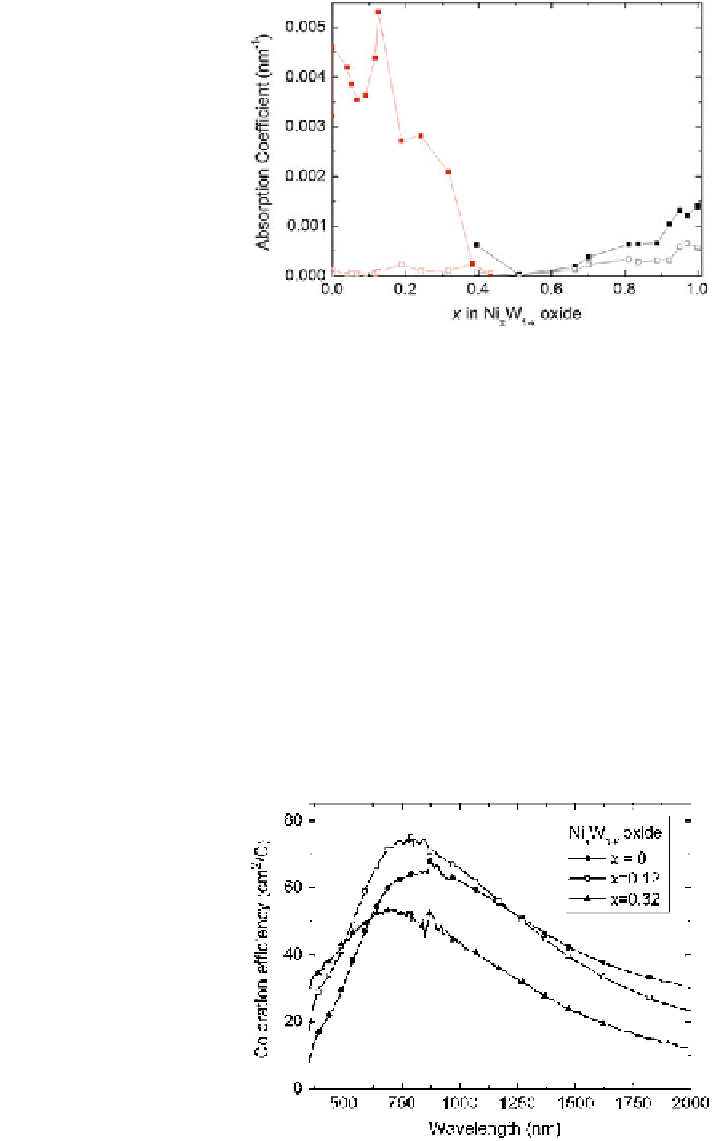
Fig. 3 Absorption
coefficient at k = 0.55 lm
for electrochromic films in
the full range between
cathodic W oxide and anodic
Ni oxide. Filled and open
symbols refer to colored and
bleached states, respectively.
Data points are connected by
straight lines. From Green
(
2012
)
unchanged after dilution with cheaper Sn or Ta (Backholm and Niklasson
2008
;
Niwa and Takai
2010
). Cobalt oxide is less widely investigated than Ni oxide, but
the two oxides share many common features (Lee et al.
2012b
). V pentoxide is
special in its display of anodic and cathodic features in different wavelength ranges
(Talledo and Granqvist
1995
) but serves mainly as an anodic oxide.
Composite oxides have received relatively scant interest as electrochromic
materials, which may seem surprising since mixing can be expected to lead to
superior performance. One exception, however, can be found in recent work by
Green (
2012
) on films in the full compositional range from W oxide to Ni oxide.
The nanostructure of the mixed material varies strongly with the composition, as
investigated by a variety of techniques (Green et al.
2011
; Valyukh et al.
2012
).
Figure
3
shows that the dependence of a key optical property, the absorption
coefficient, depends critically on the composition. In the W-rich end, there is a
conspicuous peak at *10 % of Ni for the colored films; in an intermediate range,
the electrochromism is almost zero, and at the Ni-rich end, an addition of W plays
a minor role. Figure
4
explores the optical properties for W-rich samples in more
Fig. 4 Spectral coloration
efficiency for electrochromic
films with the shown
compositions. From Green
et al. (
2012
)