Civil Engineering Reference
In-Depth Information
30
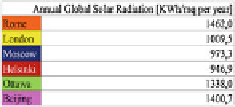
Rome
London
Moscow
Helsinki
Ottawa
Beijing
25
20
15
10
5
0
Jan
Feb
Mar
Apr
May
Jun
Jul
Aug
Sep
Oct
Nov
Dec
-5
-10
-15
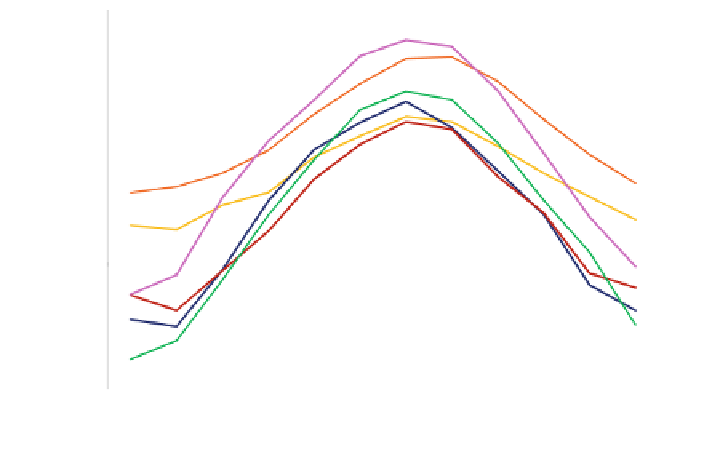
Fig. 20 Monthly mean value of external air temperature and global solar radiation for six
different cities
Table 5
EnergyPlus simulation hypotheses
Period
Simulation hypotheses
Occupancy schedule
T zone
8:00 a.m.-7:00 p.m.
Occupants: 10 persons
P zone
8:00 a.m.-5:00 p.m.
Occupants: 5 persons
Activity level
108 W/occupant
1.5 W/m
2
Lighting
HVAC system
Winter period
October 1-April 30
T set point: 20 C
Summer period
June 1-September 30
T set point: 26 C
0.22 m
3
/s
Zone infiltration
Table 6
Glazing system properties
Glazing
s—total
thickness
[m]
s
v
—visible
transmittance
[-]
g—solar
factor [-]
U—value
[W/m
2
K]
1—Standard glazing: single pane 6 mm
0.006
0.89
0.84
5.70
2—Standard double glazing: 4 mm-15 mm
(air)—6 mm
0.025
0.80
0.77
2.70
3—Low-e double glazing: 4 mm-15 mm
(argon 90 %)-4 mm low-e
0.023
0.78
0.61
1.10
4—PC panels with granular nanogel (25 mm)
0.025
0.55
0.53
0.91
5—PC panels with granular nanogel (40 mm)
0.040
0.20
0.25
0.54
6—Double glazing with monolithic aerogel:
4 mm-aerogel 20 mm-4 mm
0.028
0.60
0.75
0.50
7—Triple glazing: 4 mm low-e-15 mm
(argon 90%)-4 mm-15 mm
(argon 90%)-4 mm low-e
0.038
0.69
0.47
0.60