Civil Engineering Reference
In-Depth Information
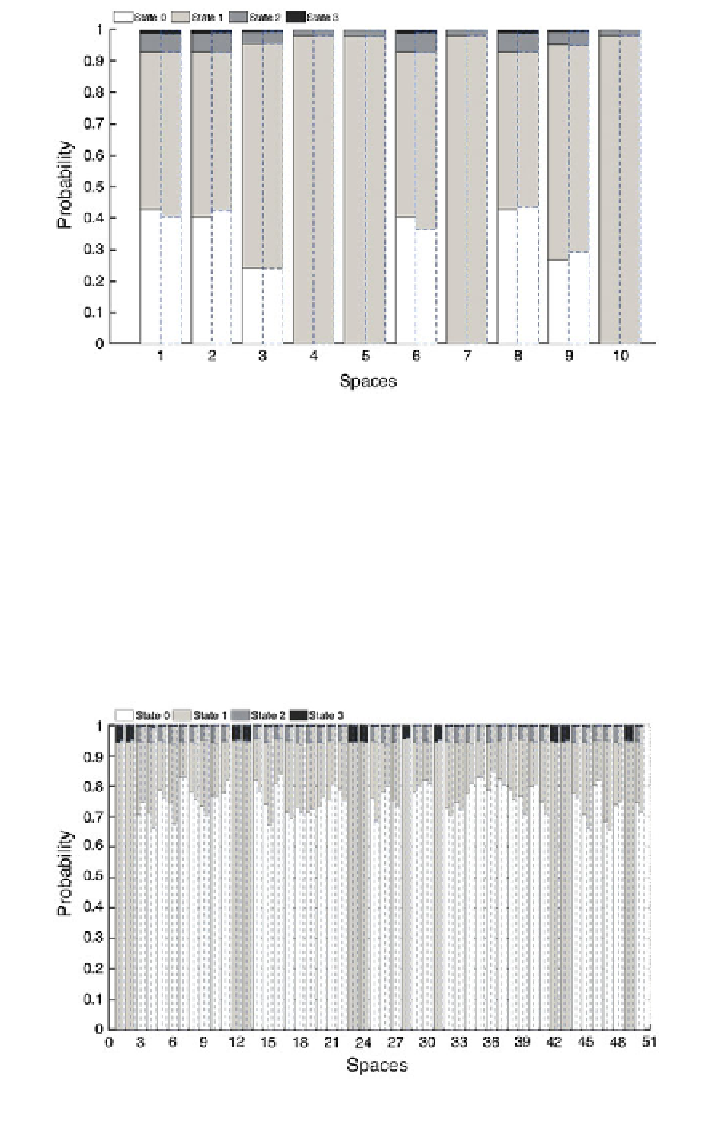
Fig. 10 Simulation results in building A with 10 spaces. Building data (right columns) and the
estimated ECM (left columns)
The case when the building size increases is analysed in Fig.
11
. This simu-
lation is performed in building B with 50 spaces, again the result shows that the
performance of the ECM is not significantly affected. This is a consequence of the
ECM structure in which the number of Markov chains represents the size of the
building and they are not strictly dependent on each other. Moreover, Fig.
11
also
illustrates the ability of the ECM to capture and to reliably predict the building
occupancy patterns, even for a building with five times more spaces.
Fig. 11 Simulation results in building B with 50 spaces. Building data (right columns) and the
estimated ECM (left columns)