Agriculture Reference
In-Depth Information
TABLE 8
(Continued)
Crop water
requirements (m
3
/
fed)
Crop
yield
(Kg/fed)
WU
s
E
WU
T
E
Irrigation
systems
Actual applied
(kg/m
3
)
Second season 2003/2004
Drip
L-H. Bubbler
Gated pipe
2016.0
2277.0
3763.0
3776.3
3506.1
2888.5
1.45
1.35
1.11
1.87
1.54
0.76
LSD
0.05
2.7
0.002
0.002
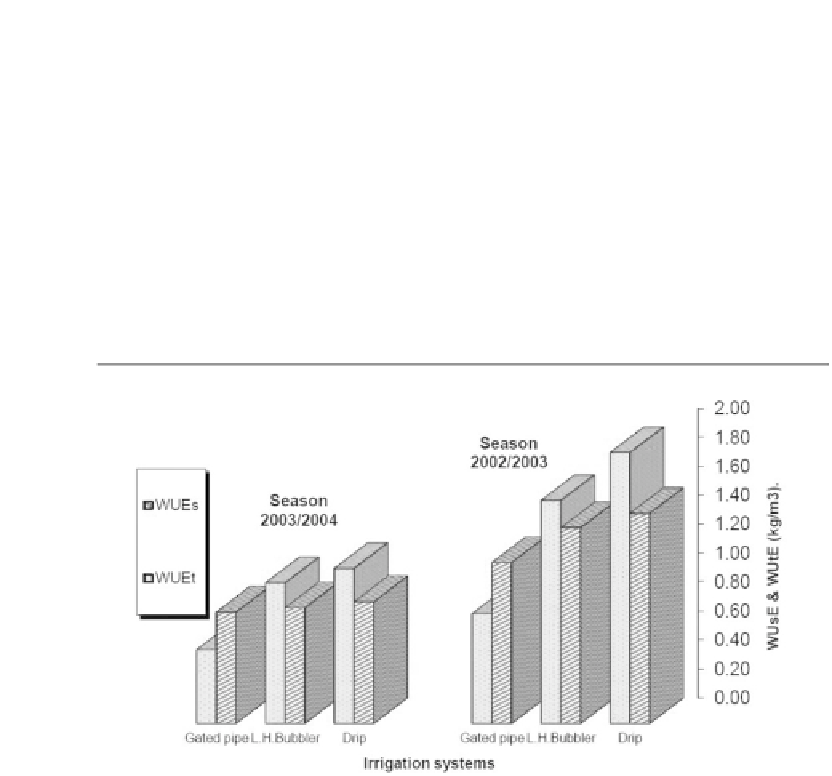
FIGURE 18
Effects of irrigation methods on water use efficiency (WU
s
E) and water utilization
efficiency (WU
T
E).
LSD
0.5
value for WU
s
E was 0.001 in 2002-2003, and 0.002 in 2003-2004 for the
three different irrigation systems. LSD
0.5
value for WU
T
E was 0.002 in 2002-2003,
and 0.002 in 2003-2004 for the three different irrigation systems. The results are in
agreement with Brown [16] and Hiler et al. [40]. The increase at the 2nd season com-
pared to the 1st season was 42% for WU
s
E and 43% for WU
T
E. These values were
maximum in DIS and minimum in GPIS.
20.3.5. FERTILIZERS USE EFFICIENCY (FUE)
The effects of irrigation systems on fertilizers use efficiency (FUE, kg yield/kg
fertilizers) for two growing seasons are shown in Table 9 and Fig. 19. During the
2002-2003season, drip irrigation system (DIS) gave highest values of FUE as 35.06,
93.18 and 22.24 for N, P
2
O
5
, K
2
O, respectively, In the low head bubbler irrigation sys-


Search WWH ::

Custom Search