Agriculture Reference
In-Depth Information
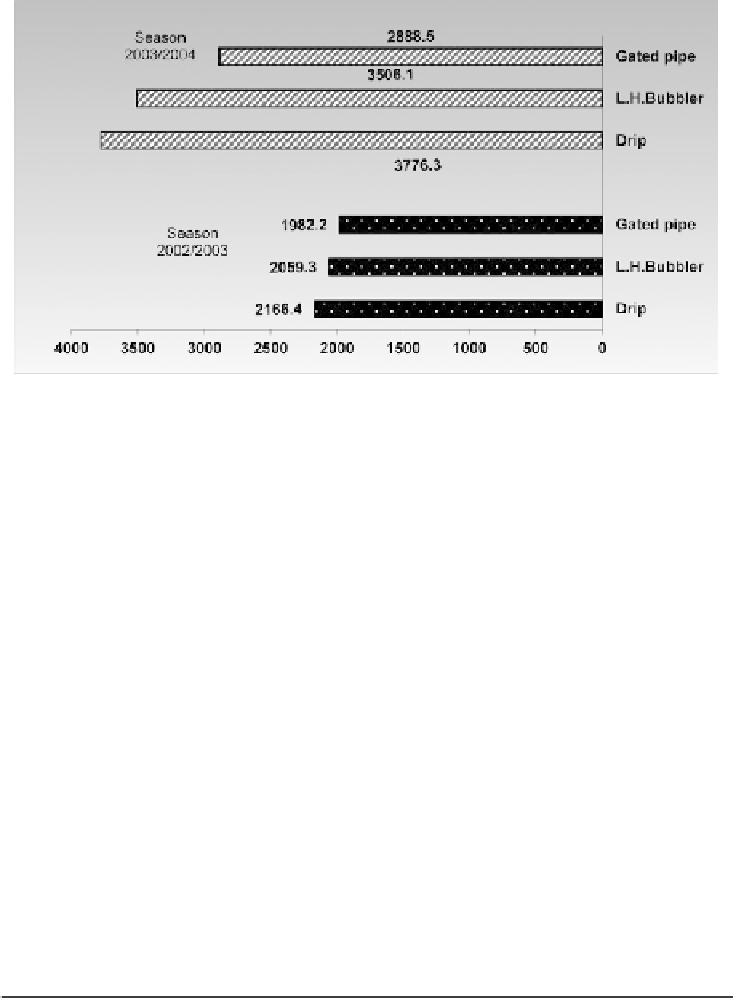
FIGURE 17
Effects of type of irrigation method on grape yield (kg per fed).
The differences in yield between any two-irrigation systems were signifi cant at the
5% level in the two seasons. The results are in agreement with Ginestar et al. [32]. The
data showed that yield increase for 2nd season compared to the 1st season was maxi-
mum for DIS (42.64%), followed by LHBIS (41.26%), while the lowest percentage of
increase was 31.37% for GPIS.
20.3.4. WATER USE EFFICIENCY (WU
S
E) AND WATER UTILIZATION
EFFICIENCY (WU
T
E)
Table 8 and Fig. 18 indicate the effects of irrigation methods on water use efficiency
(kg/m
3
) and water utilization efficiency (kg/m
3
). During 2002-2003, the WU
s
E was
0.84 and highest in DIS compared to 0.8 in LHBIS and 0.77 for GPIS. The WU
T
E was
1.07 and highest in DIS compared to 0.97 in LHBIS and 0.51 for GPIS.
During 2003-2004, the WU
s
E was 1.45 and highest in DIS compared to 1.35 in
LHBIS and 1.1 for GPIS. The WU
T
E was 1.87 and highest in DIS compared to 1.54 in
LHBIS and 0.76 for GPIS.
TABLE 8
Effects of irrigation systems on water use efficiency and water utilization efficiency.
Crop water
requirements (m
3
/
fed)
Crop
yield
(Kg/fed)
WU
s
E
WU
T
E
Irrigation
systems
Actual applied
(kg/m
3
)
First season 2002/2003
Drip
L-H. Bubbler
Gated pipe
2019.0
2110.0
3820.0
2166.4
2059.3
1982.2
0.84
0.80
0.77
1.07
0.97
0.51


Search WWH ::

Custom Search