Agriculture Reference
In-Depth Information
and 11.09% in DIS, LHBIS, and GPIS, respectively. The superiority of the studied
growth parameters for DIS and LHBIS compared to GPIS may be attributed to aggre-
gate and water intake into the deterioration and salt accumulation.
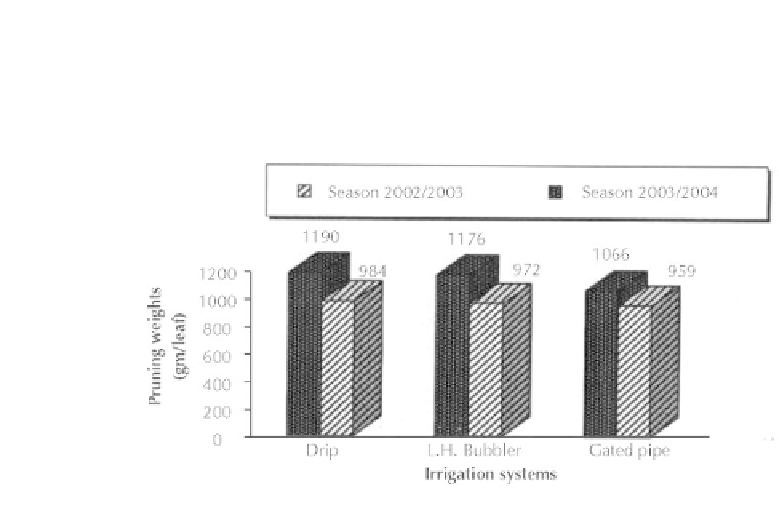
FIGURE 16
Effects of irrigation methods on pruning weight (kg/fed).
20.3.2.6 CROP LOAD
Crop load of the vineyard in the 1st season was 1.4 and highest for drip system.
The value was 1.2 for low head bubbler irrigation system, and 1.1 for gated pipe ir-
rigation system.
Crop load of the vineyard in the second season was 3.3 and highest
for drip system. The value was 2.6 for low head bubbler irrigation system, and 2.1 for
gated pipe irrigation system.
The LSD at P = 0.05 value was 0.12 and it shows that there are signifi cant differ-
ences in crop loads among all irrigation systems, with the exception of that between
low head bubbler and gated pipes irrigation systems in the 1st season. The increases
in crop load for 2003/2004 were 135.7, 116.6 and 90.9% compared to the values for
2002/2003 in DIS, LHBIS, and GPIS, respectively.
20.3.3 EFFECT OF IRRIGATION SYSTEMS ON CROP YIELD
The Fig. 17 shows the crop yield (kg per feddan) for each irrigation system. During
2002-2003, the highest yield was 2166.4 for drip irrigation system (DIS), followed
by low-head bubbler irrigation system (LHBIS: 2059.3 kg/fed). The lowest yield was
1982.2 kg/fed for gated pipes irrigation system (GPIS). During 2003-2004, the high-
est yield was 3776.3 for drip irrigation system (DIS), followed by low-head bubbler
irrigation system (LHBIS: 3506 kg/fed). The lowest yield was 2888.5 kg/fed for gated
pipes irrigation system (GPIS).


Search WWH ::

Custom Search