Database Reference
In-Depth Information
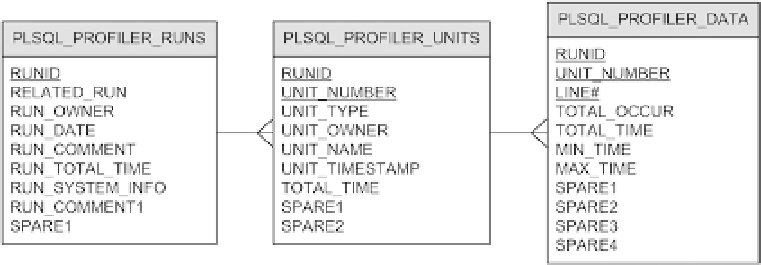
Figure 3-9.
The profiler stores the gathered information in three database tables. Notice that the primary keys
consist of the underlined columns
Installing the Output Tables
The package runs with the privileges of the user executing it. Consequently, the output tables don't necessarily need
to be created by the
sys
user. Either the database administrator, as shown here, installs the output tables (by running
the
proftab.sql
script) once and provides the necessary synonyms and privileges to use them, or each user installs
them in his own schema:
CONNECT / AS SYSDBA
@?/rdbms/admin/proftab.sql
CREATE PUBLIC SYNONYM plsql_profiler_runs FOR plsql_profiler_runs;
CREATE PUBLIC SYNONYM plsql_profiler_units FOR plsql_profiler_units;
CREATE PUBLIC SYNONYM plsql_profiler_data FOR plsql_profiler_data;
CREATE PUBLIC SYNONYM plsql_profiler_runnumber FOR plsql_profiler_runnumber;
GRANT SELECT, INSERT, UPDATE, DELETE ON plsql_profiler_runs TO PUBLIC;
GRANT SELECT, INSERT, UPDATE, DELETE ON plsql_profiler_units TO PUBLIC;
GRANT SELECT, INSERT, UPDATE, DELETE ON plsql_profiler_data TO PUBLIC;
GRANT SELECT ON plsql_profiler_runnumber TO PUBLIC;
Gathering the Profiling Data
A profiling analysis starts with enabling the profiler by calling the
start_profiler
routine. While the profiler is
enabled, profiling data is gathered for the code executed by the PL/SQL engine. Unless an explicit flush is executed by
calling the
flush_data
routine, no profiling data is stored in the output table while the profiler is enabled. The profiler
is disabled, and an implicit flush is executed, by calling the
stop_profiler
routine. In addition, it's possible to pause
and to resume the profiler by calling the
pause_profiler
and
resume_profiler
routines, respectively. Figure
3-10
shows the states of the profiler and the routines available in
dbms_profiler
that you can use to trigger a change of
state.