Database Reference
In-Depth Information
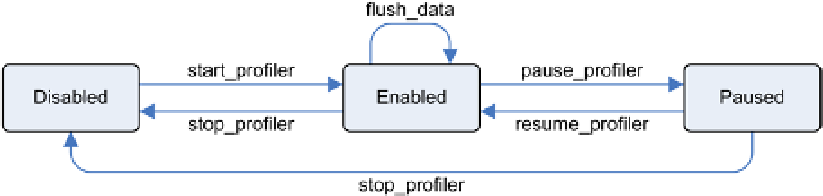
Figure 3-10.
State diagram of the profiler. The
dbms_profiler
package provides routines for changing the state of the
profiler: disabled, enabled, or paused
For each routine shown in Figure
3-10
, the package provides a function and a procedure. The functions return
the processing result status (0 = successful). The procedures raise an exception in case of error. Except for the
start_
profiler
routine, which accepts two comments describing the profiling analysis as a parameter, all other routines are
parameterless.
The following example is an excerpt of the output generated by the
dbms_profiler.sql
script. Notice that the
runid
value selected while disabling the profiler is used in the next section to reference the profiling data stored in the
output tables:
SQL> SELECT dbms_profiler.start_profiler AS status
2 FROM dual;
STATUS
----------
0
SQL> execute perfect_triangles(1000)
SQL> SELECT dbms_profiler.stop_profiler AS status,
2 plsql_profiler_runnumber.currval AS runid
3 FROM dual;
STATUS RUNID
---------- ----------
0 1
Once the profiling session is over, it's time to report the data generated by the profiler. The following two sections
describe the two main methods for doing that.
Manually Reporting the Profiling Data
Because the profiling data is stored in the output tables, it's possible to query that data with a regular query, as shown
in this section. What follows is an excerpt of the output generated by the
dbms_profiler.sql
script. The query
provides only the percentage for the response time for two reasons: first, because we're usually interested in spotting
the slowest part of the code, and second, because the timing information, especially when the code is CPU bound,