Biology Reference
In-Depth Information
96
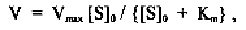
with
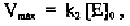
and
This equation is essentially identical to that for equilibrium saturation of
myoglobin with oxygen (see Chapter 2).
As an example, one of the glycerol dehydrogenases (McGregor
et al.
, 1974)
has been purified, and its enzymatic activity measured in the absence of any
cation (Table 4-1). For a concentration of the co-enzyme, NAD, at 0.343
mM, the velocity of the reaction, V, was expressed in mM of NADH formed
per minute per mg of enzyme, and the initial concentration of glycerol, [S]
0
,
in mM.
Table 4-1. Experimentally determined V at various [S]
0
for a glycerol dehydrogenase as
measured from one of the graphs published by McGregor
et al.
(1974).
V(mM NADH min
-1
mg
-1
)
[S]
0
(mM)
19.27 - 20.04
51.9
70.6
22.99 - 24.27
98.7
28.25 - 29.76
37.59 - 39.06
182.5
Similarly, three different plots are commonly used by biochemists to
determine V
max
and K
m
from such experimental measurements. Fig. 4-4
shows the plot of V against [S]
0
as a hyperbola. Fig. 4-5 shows that of 1/V
against 1/[S]
0
, and Fig. 4-6 that of V against V/[S]
0
, both as straight lines.
Sometimes, the axes may be exchanged.