Geoscience Reference
In-Depth Information
the plane of the Stern layer (see Figure 1.1). The electrical
potentials
pH
φ
0
,
φ
β
, and
φ
d
are related by
3
4
5
6
7
8
9
10
11
φ
0
−
φ
β
=
Q
0
C
1
1 47
10
-1
Q
S
C
2
φ
β
−
φ
d
=
−
1 48
10
-2
1.07±0.13
log
K
1
= -6.73±0.11
log
K
3
= -0.25±0.20
C
1
=
where
C
1
and
C
2
(in F m
−
2
) are the (constant) integral
capacities of the inner and outer parts of the Stern layer,
respectively. The global electroneutrality equation for the
mineral/water interface is
10
-3
mol l
-1
C
f
=
10
-2
mol l
-1
C
f
=
10
-3
10
-1
mol l
-1
This model
C
f
=
(a)
Q
0
+
Q
β
+
Q
S
=0
1 49
0
We calculate the
φ
d
potential
—
thanks to Equations
(1.38)
-
(1.49)
—
using an iterative method to solve the
system of equations. We use
Γ
-0.02
1
= 5 sites m
−
2
and
C
2
=
0.2 F m
−
2
. We use the values of
K
1
,
K
3
, and
C
1
reported
in Figure 1.5 to calculate the surface charge density
Q
0
at the surface of silica mineral and the potential
φ
d
.
The predictions of this double layer model are compared
to the literature data (zeta potential and surface charge)
in Figure 1.5. With the same model parameters, the sur-
face charge of the mineral and the zeta potential can be
described by this model as a function of the pH and salin-
ity. Such type of model can also be used to predict the
effect of specific sorption of cations like Cu
2+
on the zeta
potential/surface charge density of the silica surface.
As shown previously, the counterions are both located
in the Stern and in the diffuse layer. The fraction of coun-
terions located in the Stern layer is defined by
-0.04
-0.06
C
1
=
1.07±0.13
-0.08
log
K
1
=
-6.73±0.11
log
K
3
=
-0.25±0.20
-0.1
-0.12
Gaudin and Fuerstenau (1955)
This model
-0.14
10
-4
10
-3
10
-2
10
-1
(b)
Salinity, C (mol l
-1
)
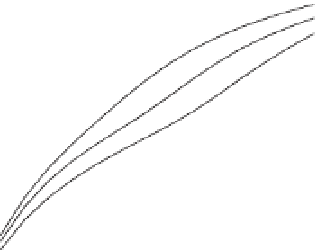
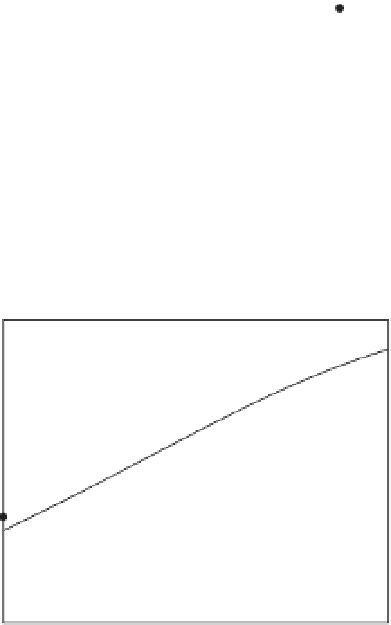
Figure 1.5
Comparison between the predictions of the triple
layer model described in the main text at the end of Section 1.1
and experimental data in the case of silica.
a)
Comparison
between the prediction of the model and surface charge density
measurements obtained by potentiometric titrations at three
different salinities (NaCl) and in the pH range 5
10 (Data from
Kitamura et al., 1999).
b)
Comparison between the model
prediction and measurements of the zeta potential at different
salinities and pH = 6.5 (Data from Gaudin & Fuerstenau, 1955).
The same model parameters are used for the two simulations.
-
0
SiONa
Γ
f
=
1 50
0
SiONa
+
D
Na
Γ
Γ
where the surface charge density of the counterions in
the diffuse layer is given by
denotes the distance defined
locally normal from the interface between the pore water
and the solid grain,
In Equation (1.52),
χ
∞
∞
e
φχ
k
b
T
−
D
Na
C
Na
+
C
f
Na
+
d
=
C
f
Na
+
Γ
≡
χ
−
χ
exp
−
1
d
χ
χ
d
is the Debye screening length (in
0
0
D
Na
is the equivalent surface density of the coun-
terions in the diffuse layer. Figures 1.6 and 1.7 show that
the fraction of counterions located in the Stern layer,
f
,
depends strongly on the salinity and pH of the pore water
solution. For example, at pH = 9 and at low salinities
(
1 51
m), and
Γ
and the electrical potential in the diffuse layer
φ
is given by
φχ
=
4
k
b
T
e
φ
d
4
k
b
T
e
−
χ
χ
d
tanh
−
1
tanh
exp
1 52
10
−
3
mol l
−
1
), most of the counterions are located in
≤