Geoscience Reference
In-Depth Information
50
100
150
200
0
100
200
0
100
200
0
100
200
0
100
200
0
100
200
0
100
200
Distance (m)
Distance (m)
Distance (m)
Distance (m)
Distance (m)
Distance (m)
0.1
P-wave
0.05
P-wave
0
−0.05
−0.
1
0
50
100
150
0
50
100
150
0
50
100
150
0
50
100
150
0
50
100
150
0
50
100
150
Time (ms)
Time (ms)
Time (ms)
Time (ms)
Time (ms)
Time (ms)
0.1
0.05
CS
CS
SE
CS
SE
SE
SE
SE
S
mall SE
0
−0.05
−0.1
0 0
100
0
0
50
100
150
0
50
100
150
0
50
100
150
0
50
100
150
0
50
100
150
Time (ms)
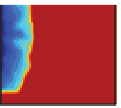
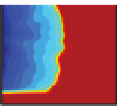
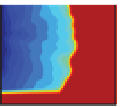
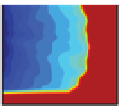
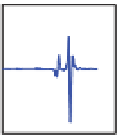
Figure 4.6
Evolution of the seismic displacement and the associated electric potential time series from receiver point E12
(see Figure 4.5) due to changes in the position of the oil/water encroachment front during snapshots T1 to T6. The arrival of
the P-wave is identified in the seismic time series. SE denotes the seismoelectric conversions occurring at any electrical and
mechanical heterogeneity in the aquifer (especially at the oil/water encroachment front), while CS denotes the coseismic
electrical field associated with the P-wave. (
See insert for color representation of the figure
.)
Time (ms)
Time (ms)
Time (ms)
Time (ms)
Time (ms)
Seismograms
Electrograms
t
0
P-wave arrivals
t
0
SE
CS
Channel E28
50
70
90
110
Channel E12
130
150
Channel E1
0
20
40
60
80
100
120
0
20
40
60
80
100
120
Time (ms)
Time (ms)
(a)
(b)
Figure 4.7
Seismogram and electrograms from implementing saturation profile T4.
a)
The seismograms reconstructed by the
geophones show the
P
-wave propagation from the seismic source in Well A to recording Well B.
b)
The electrograms show the
coseismic electrical potential field associated with the P-wave (CS) and the seismoelectric (SE) conversions with a smaller
amplitude and the same time arrival. A very small moveout can be seen in the seismic and coseismic data that is due to the
distance from the source. This moveout is not present in the seismoelectric response.