Information Technology Reference
In-Depth Information
as soon as a new sample accepted, but it may time consuming and will not gain the
global benefits. On the other hand, OFFLINE strategy needs space to store the feature
template until update procedure is invoked and cannot update as soon as possible, but
it may update globally and may cost less time. For OFFLINE strategy, we use
GMMS, MMS and sMDIST methods to verify the improvement of performance. For
ONLINE strategy, we also use the three methods after each authentication.
6 Experimental Results
The experiment is conducted on the database FVC2006 DB1A [16]which has 140 fingers
and each finger has 12 impressions. The front 8 impressions of each finger are used for
template selection and the last 4 impressions used as the future inputs for authentication.
6.1 Experiment for Template Selection
When we conduct experiment for template selection, we first select K templates based
on match scores using different strategies and then execute K matches for each authenti-
cation. At last, the K match scores are fused with max rule [10] to do final decision. In
our experiment we find that max rule has a better performance than other rules.
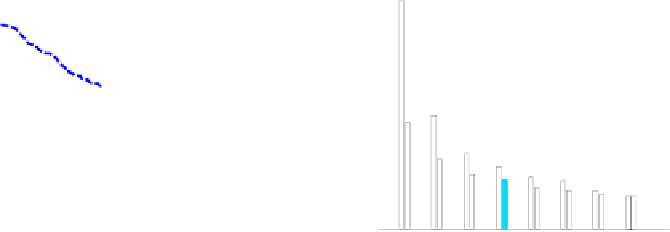
When K=1, MMS, GMMS and sMDIST are the same. Figure 1 shows the com-
parison between MMS and Random when K=1. From figure 1, we can find that tem-
plate selection can improve the performance efficiently.
Figure 2 shows EER of the four algorithms with different K(N=8). From EER as-
pects, MMS gains better performance than GMMS and other two methods. When K is
closer to N, the performance of all the methods will be closer to the performance with
Random selection strategy.
As shown from Figure 3 to Figure 10, all the three algorithms MMS, GMMS and
sMDIST gain better performance than Random. From Figure 3 and Figure 4, we can
see that when K=2, sMDIST is a bit better than MMS and GMMS. Then from Figure
5 to Figure 10, we can find that MMS and GMMS are better than sMDIST when K>2.
45
12
GMMS(K=1)
Random(K=1)
40
10
35
Random
MMS
GMMS
sMDIST
30
8
25
6
20
15
4
10
2
5
0
0
1
2
3
4
5
6
7
8
10
-2
10
-1
10
0
10
1
K (N=8)
False Accept Rate (%)
Fig. 1.
ROC curves show comparison between
MMS and Random when K=1(N=8)
Fig. 2.
EER(%) of the four algorithms: Ran-
dom, MMS, GMMS, sMDIST with different
K(N=8)


Search WWH ::

Custom Search