Chemistry Reference
In-Depth Information
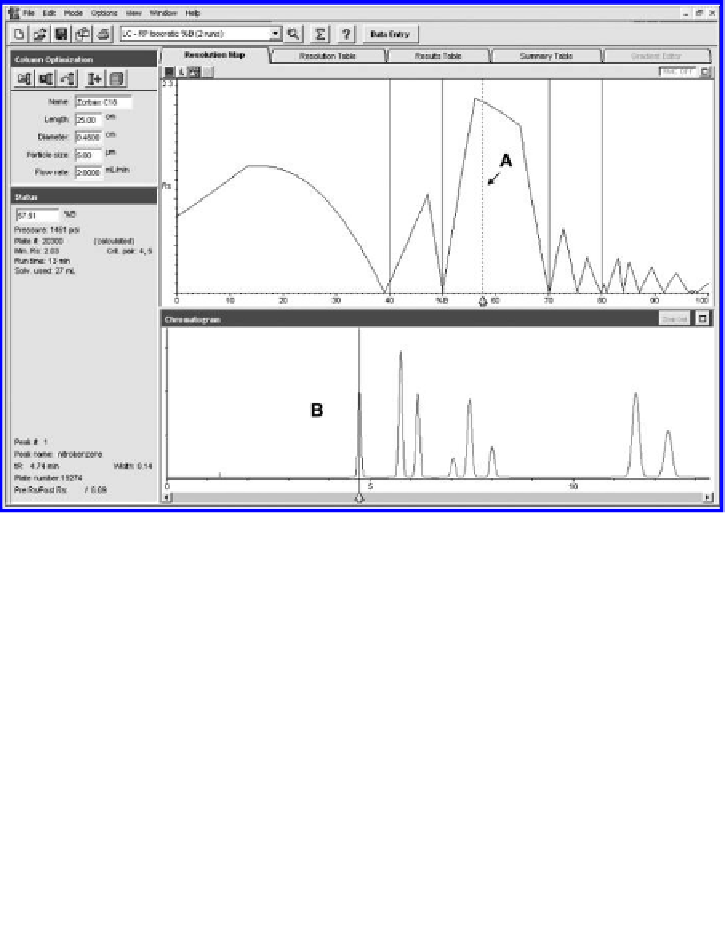
FIgure 3.7
Example DryLab resolution map. Chromatogram at point B is a prediction of
the choice of experiment dictated by the mouse placement in the software at point A. (
Source:
Figure courtesy of Molnar-Institute, Berlin, Germany.)
tAble 3.2
drylab prediction Accuracy
peak
drylab predicted t
r
experimental t
r
% error
Cocaine
3.98
3.94
0.70
Benzoylecgonine
4.31
4.23
1.32
Antipyrine
5.08
5.01
0.98
Phenacetin
9.50
9.48
0.17
Dibucaine
9.94
10.05
0.77
Methadone
10.20
10.31
0.73
Source:
Data courtesy of Molnar-Institute, Berlin, Germany.
tracking during automation. A PDA or MS spectral-based peak-tracking algorithm
allows more accurate identification of sample components during the method devel-
opment process, identifying peaks as selectivity and therefore elution order changes
over the course of a few “chemistry calibration” runs. Once the calibration runs are
processed, the chromatography variables are quickly modeled, and an optimized
chromatographic method prediction is obtained. Using systems of this type, with
intelligent decision-making software, it is not uncommon to optimize a method in as
little as four or five chromatographic runs over just a few hours [13,14].