Chemistry Reference
In-Depth Information
Purity
Auto reshold
90.00
0.60
80.00
Chromatogram
0.50
70.00
60.00
0.40
Peak Purity
50.00
40.00
0.30
0.20
30.00
reshold
20.00
0.10
10.00
0.00
0.00
16.20
16.30
16.40
16.50
16.60
16.70
16.80
16.90
17.00
Minutes
17.10
17.20
17.30
17.40
17.50
17.60
17.70
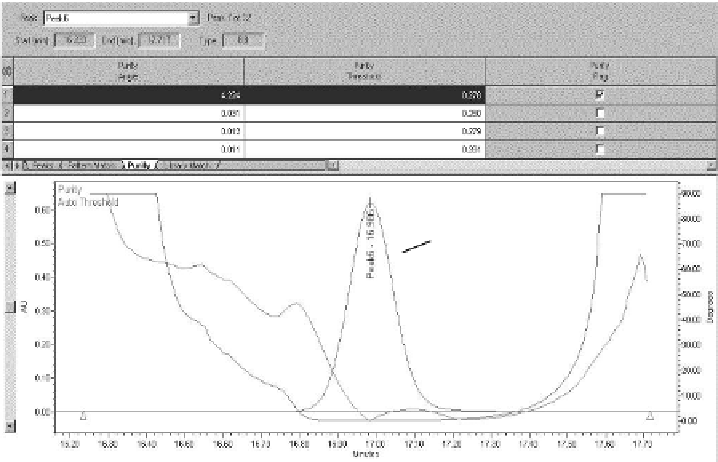
FIgure 7.5
Example PDA peak purity plot for peak 6 in Figure 7.4.
In Figure 7.5, the calculated peak purity is plotted against the noise threshold,
both superimposed on the chromatographic trace. The purity plot clearly indicates a
co-elution in the front of the peak as the purity plot exceeds the threshold, and more
method development work is necessary.
PDA detectors can be limited on occasion in evaluating peak purity, governed by
the three foregoing required components, as well as the noise of the system, and dis-
parate levels of absorbance responses. If impurities co-eluting with the API are pres-
ent at low levels (0.1%-0.5%), it will be difficult for the peak purity software to detect
the very subtle API peak spectra changes even if the impurity chromophores differ
from the APIs. This limitation is a significant concern because impurities greater than
or equal to 0.10% not qualified for safety by toxicology testing (i.e., not present in the
toxicology batch) are typically not permissible in clinical API batches unless their
structures and toxicities are known. The more similar the spectra and the lower the
relative absorbances, the more difficult it may be to distinguish co-eluting compounds.
Liquid chromatography/mass spectrometry (LC/MS) is a very powerful tool to
use for peak purity analysis, and mass spectroscopy (MS) detection has become
the detector of choice for even routine method development in many laboratories
today. MS has come a long way from the days in which many companies had a
dedicated central MS lab and staff. Modern mass spectrometers are smaller, simpler,
and operate from the same software used to operate the chromatographic system
or other detectors commonly utilized, thus decreasing the learning curve. MS can
provide unequivocal peak purity, exact mass, structural, and quantitative informa-
tion depending on the type of instrument used. MS is also a very useful tool to
track peaks as they move around in response to selectivity manipulations in method
development. Figure 7.6 is an example of how mass spectra can be extracted from a