Biology Reference
In-Depth Information
200
#
180
*
160
*
140
*
120
100
80
60
40
20
0
TOCP (mM)
Taurine (mM)
0
0
1
0
1
1
1
3
1
9
Fig. 22.2
Effects of taurine on LDH release of C6 glioma cells exposed to TOCP. C6 glioma cells
were treated with 0, 1, 3, and 9 mM of taurine for 30 min followed by exposure to 1 mM TOCP for
48 h. LDH release was measured. Data are shown as mean ± S.D. from three separate experiments;
the symbol (#),
P
< 0.05 as compared with control; the symbol (*)
P
< 0.05 as compared with
TOCP exposure alone
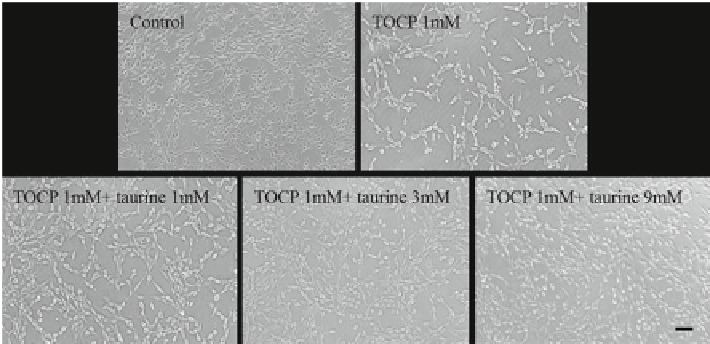
Fig. 22.3
Effects of taurine on morphological changes of C6 glioma cells exposed to TOCP. C6
glioma cells were treated with 0, 1, 3, and 9 mM of taurine for 30 min followed by exposure to
1 mM TOCP for 48 h. Cellular morphology was observed with light microscope. Scale bars,
20 m m


Search WWH ::

Custom Search