Information Technology Reference
In-Depth Information
6.6 QUALITATIVE ANALYSIS OF THE CRITICAL POINTS
OF THE GeMCA EXIN ERROR FUNCTION
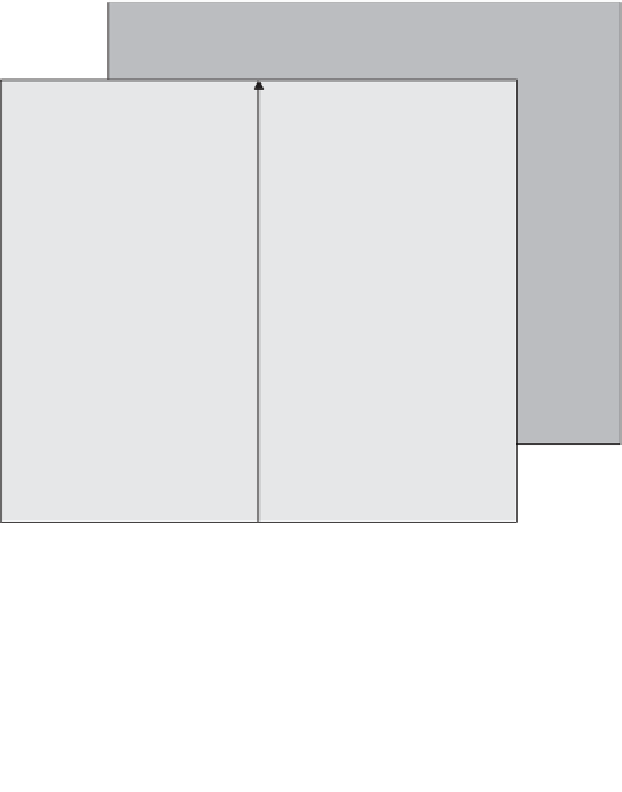
Figure 6.1 summarizes the previous analysis. For visualization purposes, the
GeTLS problem is two-dimensional
(
n
=
2
)
. The components of vector
u
are
u
1
,
u
2
,and
u
3
. The plane normal to
u
3
has been drawn, together with the TLS
hyperplane, whose equation is
u
3
1, which contains the axes
x
1
and
x
2
for
representation of the GeTLS solution
x
. All vectors point to the TLS hyperplane
(the black dots), except the
u
axes and the dashed directions. All critical directions
have been estimated by using eq. (6.21) and then scaled by means of eq. (6.22).
The results for the three particular cases OLS, TLS, and DLS are shown. All
minima (i.e., the GeTLS solutions) are shown. For DLS, the maximum is parallel
to
e
3
and corresponds to an infinite eigenvalue. For decreasing (decr.)
=−
,the
critical vector corresponding to a saddle or to a maximum tends to move toward a
direction parallel to the TLS hyperplane (front plane in the figure) approaching the
OLS case. For OLS only the minimum vector intersects the TLS hyperplane and
so yields the corresponding OLS solution. The other critical directions correspond
to infinite eigenvalues.
ζ
TLS hyperplane
DLS saddle
x
2
u
2
DLS min
TLS min
TLS saddle
OLS min
x
1
DLS max
decr.
ζ
decr.
ζ
u
1
decr.
ζ
TLS max
OLS saddle
direction
u
3
OLS max
direction
Figure 6.1
GeMCA EXIN and GeTLS EXIN critical directions and points.


Search WWH ::

Custom Search