Environmental Engineering Reference
In-Depth Information
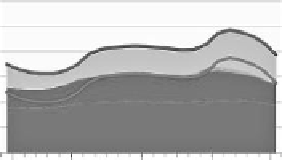
Winter
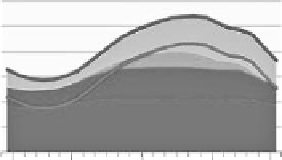
Summer
7,000
6,000
5,000
4,000
3,000
2,000
1,000
1 am
6 am 12 pm
6 pm 11 pm 1 am
6 am 12 pm
6 pm 11 pm
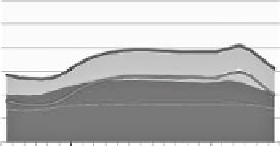
Fall
Spring
7,000
6,000
5,000
4,000
3,000
2,000
1,000
1 am
6 am 12 pm 6 pm
Coal
Total Load
11 pm 1 am
6 am 12 pm 6 pm 11 pm
Gas-CC
Gas-CT
Wind & Other
Total Load Minus 1,100 MW Wind
FIGURE 2.2
Impact of wind on power generation stack.
PSCO has another, somewhat restricted, option for offsetting wind genera-
tion. It uses its 350 MW of pumped storage hydroelectric power to accommo-
date wind as much as possible, but when that facility is running at maximum
capacity, it can only operate consecutively for 4 hours.
How frequently wind affects coal- and natural gas-fired generation is dif-
ficult to determine because PSCO does not publish hourly wind generation
data.* Nevertheless, PSCO acknowledges wind impacts on both coal and
gas in its addendum to the 2006 Wind Integration Study for Public Service
Company of Colorado.
2,3
In Appendix B of the 2008 addendum, PSCO noted
“a discrepancy between the Cougar modeling and the current experience
when comparing the impacts on coal units. The modeling predicts almost no
impact, but the company [PSCO] is already seeing some cycling that seems
related to wind output.”
†
In other areas of the country, information on wind power is a required
component of power generation reporting. For example, utilities in the
ERCOT area of Texas are required to report their power generation by fuel
type every 15 minutes. Data for 2007, 2008, and 2009 were used to com-
pare coal-plant cycling with wind generation. The analysis identified the
*
Bentek and the Independent Petroleum Association of the Mountain States (IPAMS) repeat-
edly tried to obtain 2008 hourly wind generation data from PSCO. All requests were denied
because PSCO contends that the data represent confidential trading information.
†
PSCO uses the Cougar model to measure the cost impacts of integration.