Environmental Engineering Reference
In-Depth Information
1,307
60%
1,169
72%
2007 2008 2009
Total number of cycles
% Wind induced cycles
779
61%
750
62%
568
66%
371
63%
233
72%
125
73%
51
71%
47
83%
21
90%
10
80%
2
50%
4
75%
2,000+MW
5
80%
300-500 MW
500-1,000 MW
1,000-1,500 MW
1,500-2,000 MW
Source: BENTEK Energy and CEMS
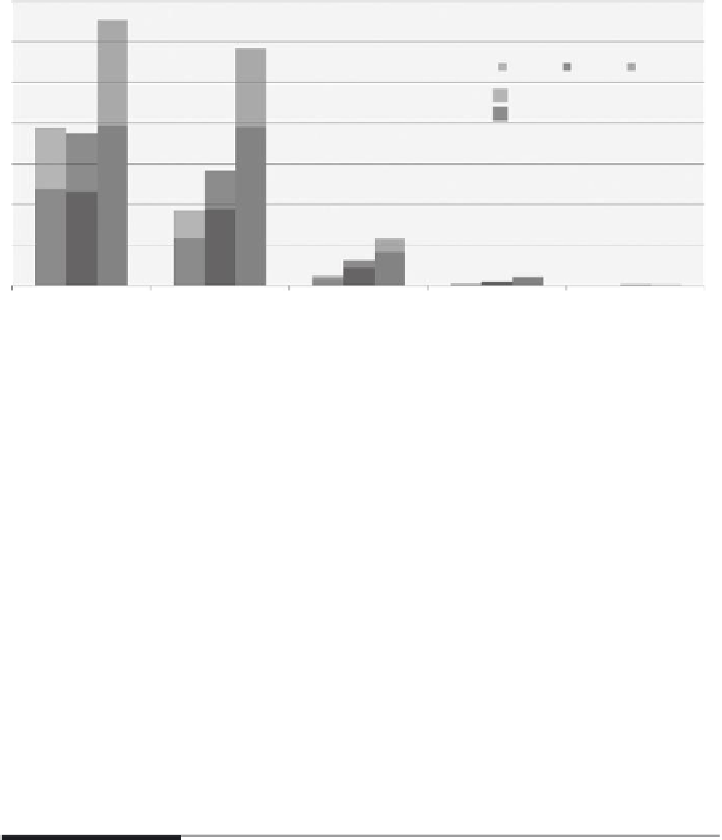
FIGURE 2.3
Distribution of magnitude of ERCOT coal cycling showing hour-by-hour changes.
number of times coal-fired power plants cycled down by 300 to 500 MW,
500 to 1,000 MW, and more than 1,000 MW during the same time periods
when wind generation increased by a similar amount. Figure 2.3 shows
the results.
In 2009, 1,307 instances in which coal plants were cycled at least 300 MW
and 284 examples of cycling more than 1,000 MW from one 15-minute period
to the next were reported. Furthermore, the number of instances increased
annually since 2007. While Texas has more coal plants and wind farms than
Colorado and the Texas wind exhibits somewhat different behavior, this
analysis concludes that the two systems are similar enough for a valid com-
parison. Even in Texas, which has one of the nation's largest gas-fired genera-
tion bases, coal plants are frequently cycled. It clearly stands to reason that
the same dynamic occurs in Colorado.
ImpactsofCycling
Power plant cycling increases fuel use for every megawatt hour generated.
As shown in the first case study discussed in the following section, coal con-
sumption due to cycling exceeded by 22 tons the amount that would have been
consumed if the plant had not been cycled (and generation remained stable).
Figure 2.4 depicts operations at PSCO's Cherokee Unit 4* near Denver
between 7:00 p.m. and 9:00 a.m. on March 17 and 18, 2008. Total generation
*
The Cherokee 4 boiler is a 352-MW unit in a 717-MW coal-fired plant in Denver County,
CO.