Biomedical Engineering Reference
In-Depth Information
0
-5
-10
-15
-20
4
Normal foot
Normal foot
2
0
Hallux valgus foot
-2
-4
-6
-
15
Hallux valgus foot
-25
0
0
-5
0
10
20
-10
20
40
5
-15
40
60
-20
60
(a)
0
80
(b)
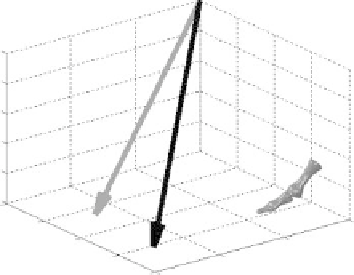
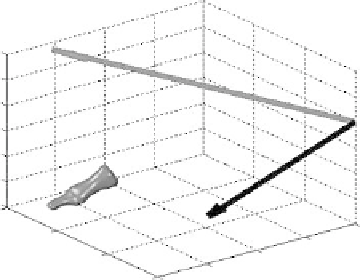
FIgure 4.4
The metatarsocuneiform (a) and metatarsophalangeal (b) joint force of the normal and hallux
valgus foot. The direction of joint force is imposed from the proximal segment on the distal segment.
4.3.3 p
lantar
p
reSSure
d
iStriBution
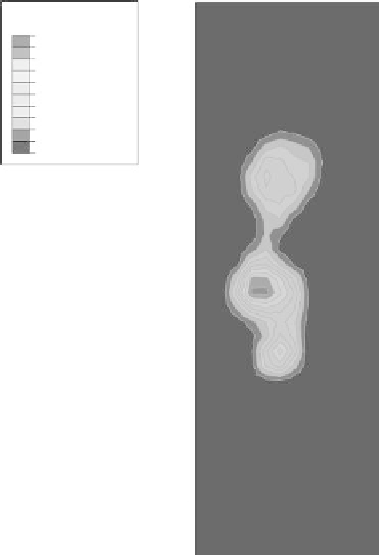
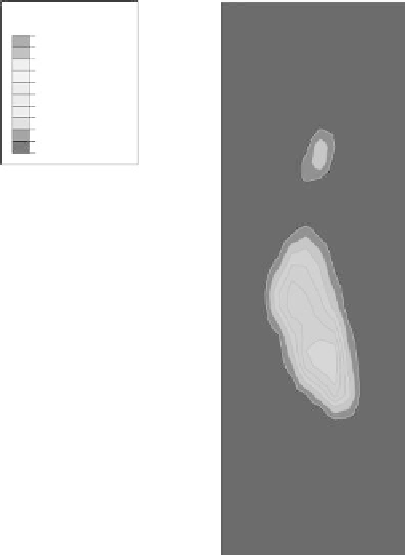
The plantar pressure pattern on the supporting plate is shown in Figure 4.5. The localized pressure
of the phalanges segment and the distal metatarsal segment can be seen clearly. The normal foot
exhibited a concentrated pressure on the more distal portion of the metatarsal, while the hallux foot
presented a more evenly distributed pattern with concentrated pressure at a more proximal location.
The contact area of the hallux was also smaller in the hallux valgus foot. The peak contact pressure
of the normal foot was 0.094 MPa, which was larger than the 0.069 MPa for the hallux valgus foot.
CPRESS
+
1.000e
-
01
+
9.000e
-
02
+
8.000e
-
02
+7
.000e
-
02
+6
.000e
-
02
+
5.000e
-
02
+
4.000e
-
02
+
3.000e
-
02
+
2.000e
-
02
+
1.000e
-
02
+
0.000e
-
00
CPRESS
+
1.000e
-
01
+
9.000e
-
02
+
8.000e
-
02
+7
.000e
-
02
+6
.000e
-
02
+
5.000e
-
02
+
4.000e
-
02
+
3.000e
-
02
+
2.000e
-
02
+
1.000e
-
02
+
0.000e
+
00
(a)
(b)
FIgure 4.5
(See color insert.)
The plantar pressure distribution on the supporting plate of the normal (a)
and hallux valgus (b) foot. Unit: MPa.


Search WWH ::

Custom Search