Biomedical Engineering Reference
In-Depth Information
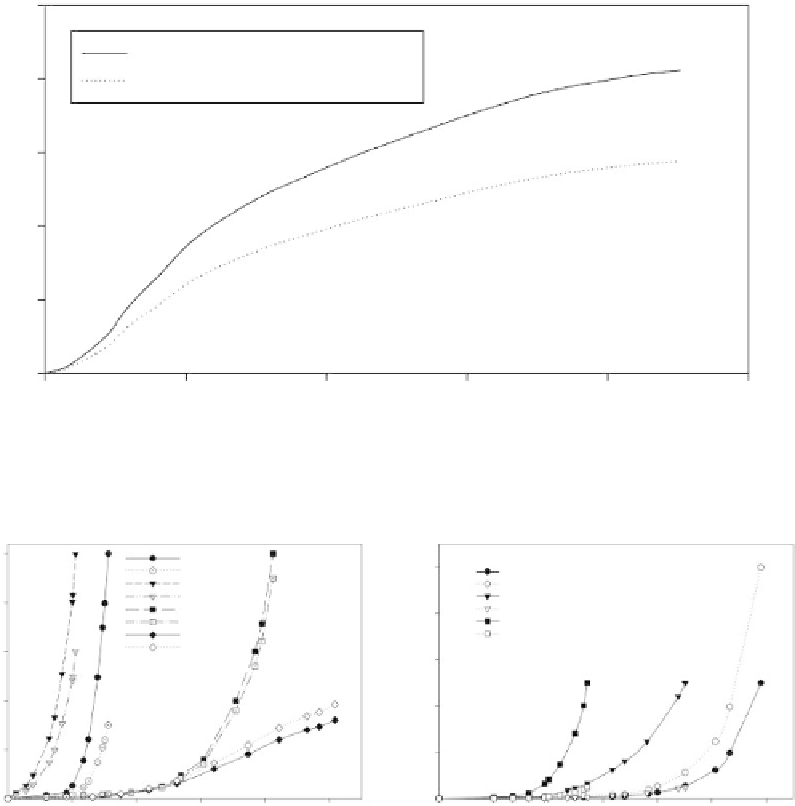
introduced to weight the stress-strain curve of the collagen fibers. The calibration factor was varied
to obtain the optimal value that could permit the range of motion predicted by the model to match
well with the in vitro experimental results under a bending moment in different directions (Schmidt
et al., 2006). The calibration factors of different ligaments were acquired in a similar way (Schmidt
et al., 2007). The calibration results of the collagen fibers are shown in Figures 18.10 and 18.11.
Validation was then undertaken by comparing the data predicted by the current model with
results from other studies in the literature. The range of motion of each segment under different
moments in three principal planes and the disc compression under a follower load of 1200 N were
calculated for comparison with the experimental and simulated data reported by Renner, Natarajan,
and Patwardhan (2007). The magnitudes of the bending moments were 6 NM for extension, 8 NM
for flexion, 4 NM for torsion, and 6 NM for lateral bending. The loading was exposed on the supe-
rior surface of L1 and the boundary condition was simulated by fixing S1 in the same way as the in
vitro experiment. The range of motion of each vertebra was determined by taking the sum of two
motions in each plane, and the degree of disc compression was evaluated by directly measuring the
change in thickness. The validation results are shown in Figure 18.12.
100
Shirazi-Adl et al.(1986)
80
Calibrated stress-strain curve
60
40
20
0
0
5
10
15
20
25
Strain in %
FIgure 18.10
Calibrated stress-strain curve of collagenous fiber.
250
PII In vitro
500
PII FEM
AII FEM
FC In vitro
FC FEM
ITL FEM
FL In vitro
AII In vitro
FL FEM
SSL In vitro
SSL FEM
ISL FEM
200
400
ISL In vitro
ITL In vitro
150
300
100
200
50
100
0
0
0
1
2 3
Deflection (mm)
4
5
0
1
2
3
Deflection (mm)
4
5
6
FIgure 18.11
Calibrated defection-force curves of ligaments.
Search WWH ::

Custom Search