Biomedical Engineering Reference
In-Depth Information
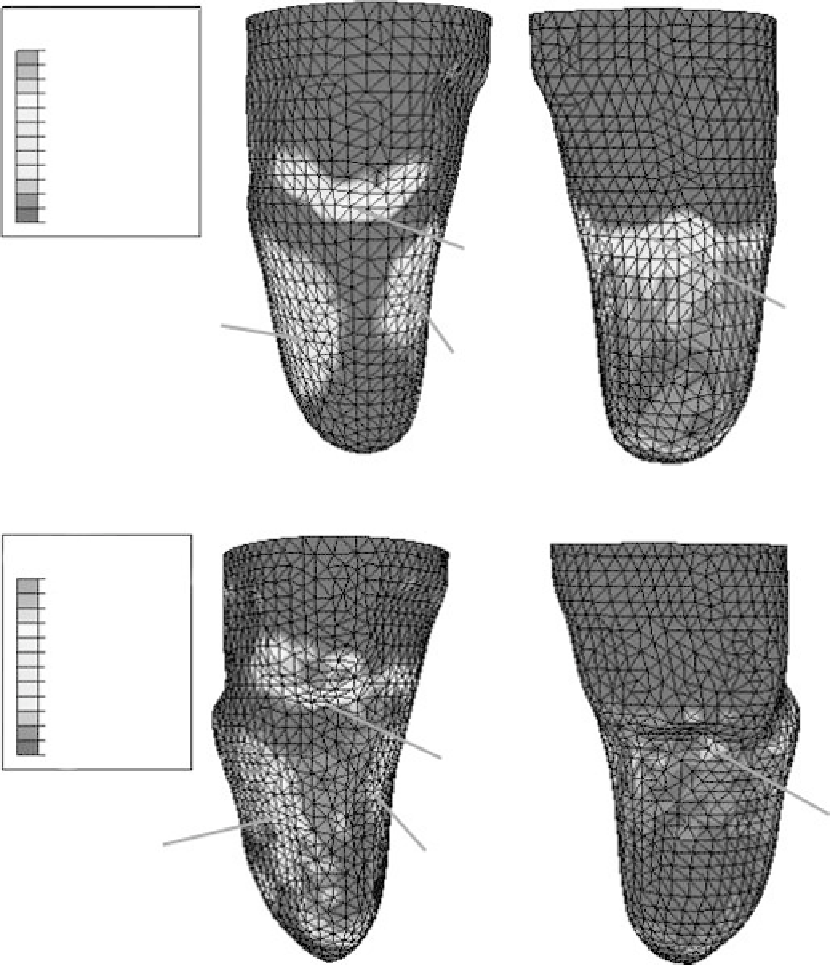
Anterior view
Posterior view
(MPa)
Resultant shear
+ 7.693e - 02
+ 7.052e - 02
+ 6.411e - 02
+ 5.770e - 02
+ 5.129e - 02
+ 4.488e - 02
+ 3.847e - 02
+ 3.206e - 02
+ 2.564e - 02
+ 1.923e - 02
+ 1.282e - 02
+ 6.411e - 03
+ 0.000e - 00
65 kpa
52 kpa
58 kpa
77 kpa
(a)
(MPa)
Resultant shear
+ 7.693e - 02
+ 7.052e - 02
+ 6.411e - 02
+ 5.770e - 02
+ 5.129e - 02
+ 4.488e - 02
+ 3.847e - 02
+ 3.205e - 02
+ 2.564e - 02
+ 1.923e - 02
+ 1.282e - 02
+ 6.411e - 03
+ 0.000e + 00
60 kpa
18 kpa
35 kpa
31 kpa
(b)
FIgure 13.5
(See color insert.)
The anterior and posterior views of resultant shear stress distribution
(a) with pre-stress considered and (b) with pre-stress ignored upon application of 800 N.
Stress distribution patterns over the residual limb and peak stress values over the four pressure-
tolerant regions were different in the second model, which ignored pre-stress and incorporated a
simplifying assumption that the shape of the limb and rectified socket were the same. Figure 13.4b
shows the normal stress distribution and Figure 13.5b shows the resultant shear stress distribution
over the limb upon application of 800 N to the second model. Stresses were more evenly distributed
in the second model. Peak normal and resultant shear stresses were lowered over the four pressure-
tolerant regions where socket undercuts were made, but higher stresses fell on regions that were not
pressure tolerant.
Search WWH ::

Custom Search