Database Reference
In-Depth Information
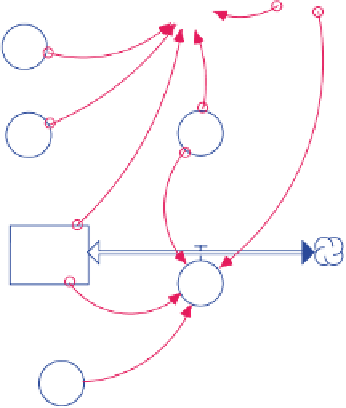
Table 13.1
Figure
Description
R
A
K
H(t = 0)
P(t = 0)
13.9
Steady State
0
.
50
0
.
20
14
.
5
10
.
00
1
.
00
13.10
Limit Cycle
2
.
00
0
.
20
21
.
5
10
.
00
1
.
00
13.11
Chaos
2
.
65
0
.
20
25
.
0
10
.
00
1
.
00
H
²H
R
A
K
P
²P
Fig. 13.8
have a number of life cycle stages—eggs, larvae, pupae, and adults—and their
interaction is limited to a subset of these.
a. Can you modify the model to account for the fact that it is typically only the
larvae of the host that get parasitized by adult parasitoids?
b. How does this disaggregation of the parasitoid and host population affect your
results?
c. Can you find parameters and initial values that generate alternatively steady
state, limit cycles, or chaos?
d. What is the appropriate DT to use here and how are the results affected by its
choice?
2. Try reducing the DT. In the earlier graphs, DT is set at 1.00. A smaller DT yields
a completely different answer. What is going on here? Is the DT of 1.00 required
by the host or the parasitoid? (The Nicholson-Bailey model views t = 1 as one
generation and all the dynamics for one DT go on inside that time period of 1.00.