Database Reference
In-Depth Information
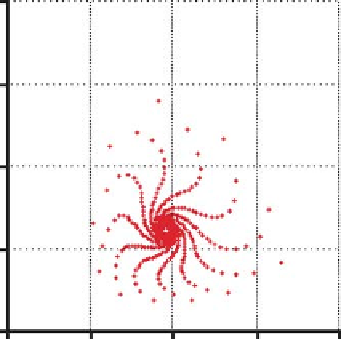
1: H v P
5.00
2.50
P
0.00
0.00
6.00
12.00
H
Fig. 13.9
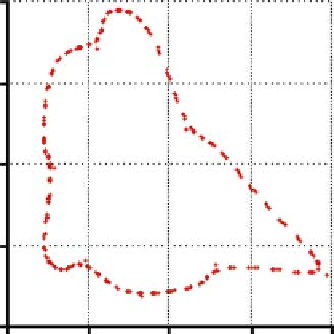
1: H v P
12.00
P
6.00
0.00
0.00
12.00
24.00
H
Fig. 13.10
It is as though the whole new generation of the two populations is formed just
before the beginning of that generation. So in this model, a DT less than 1.00 has
no meaning.)
3. Do a sensitivity analysis on the initial values of H and P, on R, A, and K.