Database Reference
In-Depth Information
1: SICK
1:
80
1
1
1
1
1:
45
1:
10
0.00
50.00
100.00
150.00
200.00
Time
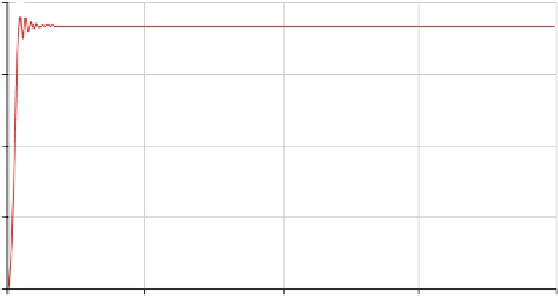
Fig. 13.4
1: SICK
1:
100
1
1
1
1
1:
55
1:
10
0.00
50.00
100.00
150.00
200.00
Time
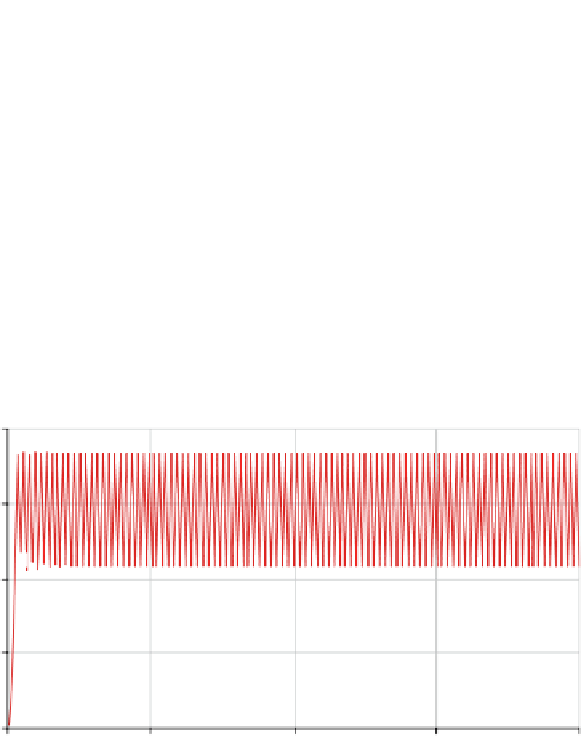
Fig. 13.5
Sensitivity of the nonlinear model to initial conditions is an attribute of chaotic
models. Models that show chaos may not show it for all combinations of the para-
meters and detecting the advent of chaos becomes the issue. In these cases, we can
examine a scatter plot of the state against the one-DT lagged value of that state. If
we see the formation of a pattern, such as a curve, where the successive points are
landing on opposite sides of that curve (each time in a different place), we have a
model with chaos. If this graph show oscillation between opposite sides of the curve
but always between the same two points, we have a model in oscillation. If the
curve shows progression to a point, we have a model at steady state. Some models
will start off oscillating and then dampen down to a steady state. These descriptions