Database Reference
In-Depth Information
1: SICK
1:
110
1
1
1:
60
1
1
1:
10
0.00
50.00
100.00
150.00
200.00
Time
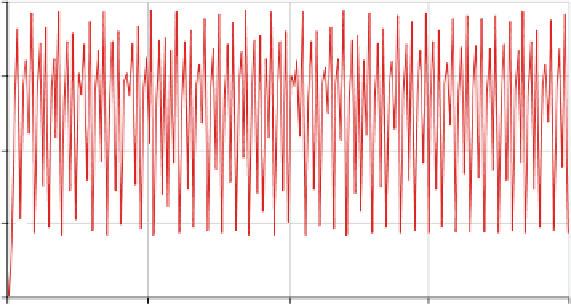
Fig. 13.6
SICK v. LAG SICK:
1 -
110
60
10
10
60
110
LAG SICK
Untitled
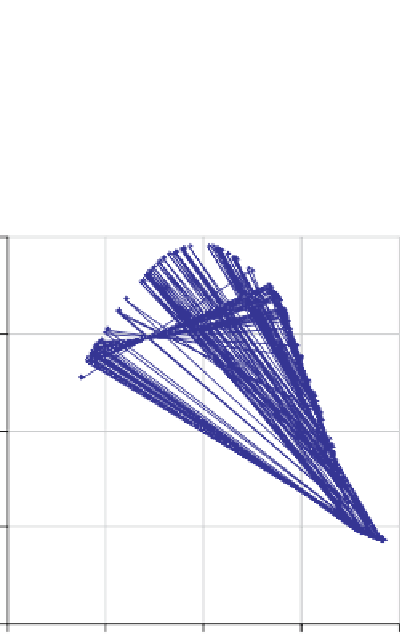
Fig. 13.7
of the appearance of chaos in models can be helpful to the beginning modeler. The
key idea is to recognize when one has chaos and when one has random variation.
In a time series,plot both will appear to be random. However, in the scatter plot, the
model's randomness appears as a uniform randomness across the range of the plot.
If random variation appears in a time series plot of a model containing no random