Database Reference
In-Depth Information
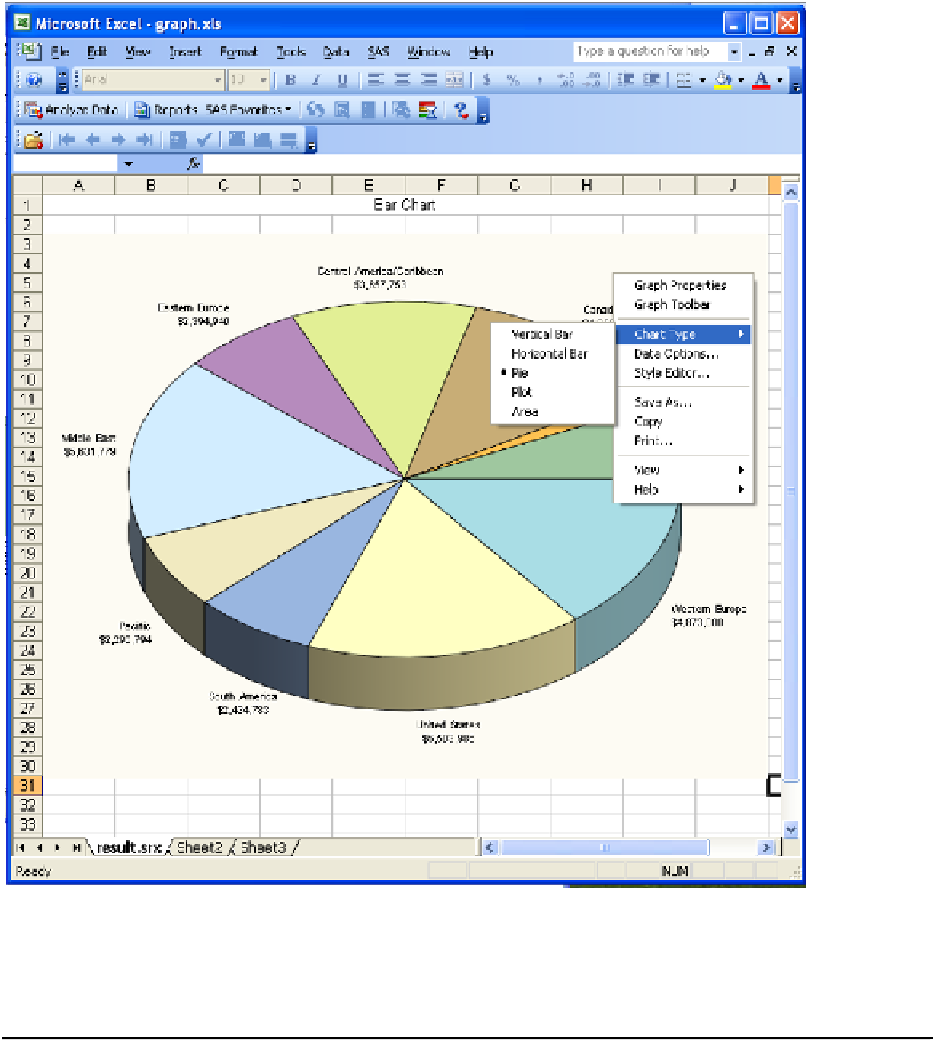
Figure 5.6: The Result of Changing an ActiveX Bar Chart to a Pie Chart in an Excel
Workbook.
The Excel version shown in Figure 5.6 is an older version of Excel than the image in Figure 5.5. I used the
older version because I was able to show the ActiveX command menus in this image. A SAS Enterprise
Guide report can be processed in the same manner as the graph above when you have the SAS Add-In for
Microsoft Office installed.
Example 5.4 Using the “Export” Method to Output a Graph or Report
This example shows how SAS can create a graph or report file to export to Microsoft Excel. SAS Add-In
for Microsoft Office must be installed. This section also assumes that you have generated a graph or report
using SAS Enterprise Guide 4.3 or later. The next chapter will deal directly with the features of SAS Add-
In for Microsoft Office.
Search WWH ::

Custom Search