Information Technology Reference
In-Depth Information
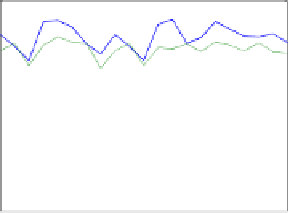
Revenue of Agents in Experiment A
Revenue of Agents in Experiment B
60
60
SouthamptonSCM
HP−Agent
SouthamptonSCM
40
40
HP−Agent
20
HV−Agent
20
0
HV−Agent
−20
0
Dummy Agent
Dummy Agent
−40
−20
−60
−40
−80
1
2
3
4
5
6
7
8
1
4
7
10
13
16
19
21
Game
Game
(a)
(b)
Revenue of Agents in Experiment C
60
SouthamptonSCM
HP−Agent
20
HV−Agent
−20
−60
−100
Dummy Agent
−140
−180
1
4
7
10
13
16
19
21
Game
(c)
Fig. 3.
Revenue of each kind of agent
We now start to analyse the performance of the different agents as shown in Fig-
ure 3.
10
In experiment A, it can be seen that SouthamtptonSCM performs significantly
better than the other two agents and that the HP-agent is better than the HVs. In exper-
iment B, SouthamptonSCM is significantly better than both HP-agents and HV-agents
and the HP-agents are better than the RAs. In experiment C, SouthamptonSCM is sig-
nificantly better than the other two, however we cannot differentiate statistically which
agent is better between HP and HV agents. Now, in all cases, we can attribute this suc-
cess of SouthamptonSCM solely to the adaptivity aspect of its pricing (because this is
the only difference between the agents). Moreover, we found that the average revenue
SouthamptonSCM obtained is 49
.
7% higher than HP-agents in experiment A, 129
.
7%
higher in experiment B, and 58% higher in experiment C. This means, relatively speak-
ing, SouthamptonSCM does best in experiment B. It is interesting that there are more
HP-agents in experiment B than in A (
i.e.
, our agent performs better in a more uncertain
environment). This further shows that the adaptivity of prices are effective in this case.
However, in experiment C, more agents use the Day-0 bidding strategy and this affects
all the agents greatly (see the discussion below).
10
Statistical significance is computed by a Student's t-test and this shows all results are signifi-
cant (
p<
0
.
05).