Information Technology Reference
In-Depth Information
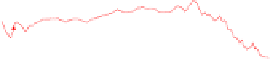
Average Daily Offer Price ($/cycle)
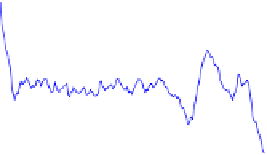
Average Daily Order Quantity (cycles)
500
5000
SouthamptonSCM
HV−Agent
HP−Agent
SouthamptonSCM
HV−Agent
HP−Agent
4000
400
3000
2000
300
1000
200
0
0
40
80
120
160
200
0
40
80
120
160
200
Simulation Day
Simulation Day
(a)
(b)
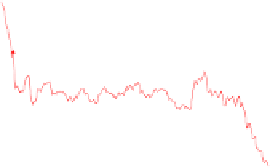
Average Daily Order Revenue ($)
x 10
6
2
SouthamptonSCM
HV−Agent
HP−Agent
1.5
1
0.5
0
0
40
80
120
160
200
Simulation Day
(c)
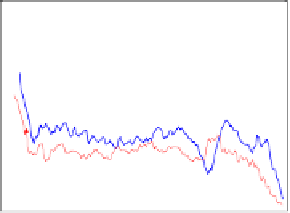
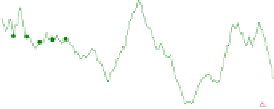
Fig. 4.
Comparison of offer prices, quantity and revenue in the controlled experiment
To understand better about how the pricing of SouthamptonSCM works, we further
observed for each simulation day, the daily price (Figure 4 (a)) offered by each agent
and the average daily order quantity that each agent won (Figure 4 (b)). These values
are averaged over all PC types. We then plot the average daily revenue (Figure 4 (c)).
Here, again, we take a randomly chosen representative game to show how the pricing
of these three kinds of agents operates. As expected, the prices that SouthamptonSCM
offers are roughly between the other two (below that of HP-agents and above that of
HV-agents). For an HV-agent, the offer prices are very low, thus, although it can sell a
large quantity of PCs, it cannot make much profit. Specifically, we found that the HV-
agent can almost always win orders (the ratio of the number of orders offered to the
quantity of orders won is almost 1:1and the factory utilisation is almost 100%). For
the HP-agent, however, the prices are always high, meaning they build up a large stock
of PCs and components in the factory. Thus only a small number of their orders make
much profit although selling prices are high. Through adaptation, SouthamptonSCM
can make its offer prices high enough (sometimes the average prices are even higher
than HP-agents, see Figure 4 (a)), but, at the same time, guarantee a large number of
orders (see Figure 4 (b)). This is demonstrated by the fact that its factory utilisation is
almost 100%. Consequently, its revenue is higher than the other two (see Figure 4 (c)).