Civil Engineering Reference
In-Depth Information
c
a
b
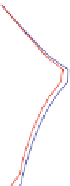
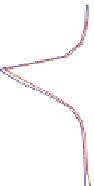
Fig. 5.40 Comparison over depths of velocity components (a)
u
and (b)
w
and (c) temperature for
simulation based on 60-m (
blue
) and 30-m (
red
) depths at positions in km
P
1(0,
12),
P
2(0,6) and
for velocity component
u
, additional
P
3(0,0).
Horizontal dotted line
marks the depth of the
thermocline; the vertical one separates positive and negative values
result in two dominant up- and downwelling cells around the OWF. Especially
along W-E section through the OWF (Fig.
5.39
b2), the upwelling is undisturbed
with depth and more consistent in HD30 than in HD60. In case HD60 occurs after
1 day of simulation a zone of downwelling below the thermocline and eastward of
the OWF. In case HD30, the effect shown at 12-m depth (Fig.
5.39a
) can be broaden
from surface to bottom. Simulation HD30 has got a more intensive downwelling of
maximal
10
5
m/s over the
whole model box, and also the mean of downwelling over the affected area leads to
a
10
5
m/s, compared to HD60 with
5.46
4.37
10
6
stronger
effect by HD30 with
1.27
m/s
than HD60 with
10
6
m/s. The depth where the extrema occur is 12 m in both cases. The
maximal upwelling occurs in depth of 10 m for both cases, and again the run HD30
shows here a stronger value being 0.11
1.09
10
6
m/s higher than in case HD60.
Below 10 m, the upwelling is weaker than in 10-m depth for both simulations, but
the run HD60 becomes here more intensified due to bottom friction affecting results
in run HD30. In the horizontal, HD30 tends to location of extrema through layers
being closer to OWF grid boxes with maximal differences to HD60 by 6 km in
x
-
direction, so two grid boxes, and 3 km in
y
-direction; location of extrema of H60 is
slightly more easterly positioned after 1-day simulation. Inspection of distribution
of
w
-component at points
P
1 and
P
2 (Fig.
5.40b
) shows that downwelling at
P
2is
weaker in HD60 while upwelling at
P
1 is nearly identical till 4-m depth. Below 4 m
and, especially, from 10 m on, HD30 gives a lower upwelling.
One must note that the position of investigation
P
2 does not fit with the position
of overall maximal upwelling; that is why run HD60 dominates here in the upper
layers. The dominant downwelling for HD30 is registered for the whole 30-m ocean
depth. Correlations of
w
-component of runs HD60 and HD30 are 0.98 in
P
1 and
0.95 in
P
2, while again main discrepancies occur below the thermocline due to
different defined depths of the model bottom. The two simulations are more highly
biased for downwelling by 9.15
10
6
m/s, while upwelling is only biased by
10
7
m/s.
4.5


Search WWH ::

Custom Search