Biomedical Engineering Reference
In-Depth Information
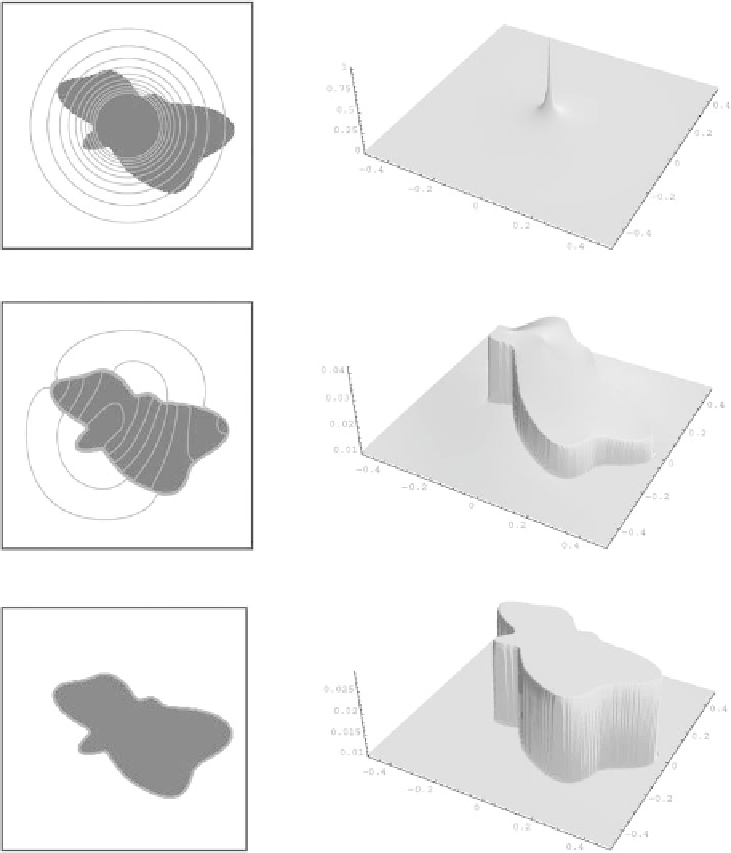
Figure 11.11:
Subjective surface based segmentation of a “batman” image. In
the left column we plot the black and white images to be segmented together
with isolines of the segmentation function. In the right column there are shapes
of the segmentation function. The rows correspond to time steps 0, 1, and 10,
which gives the final result
ε
=
1 (color slide).