Biomedical Engineering Reference
In-Depth Information
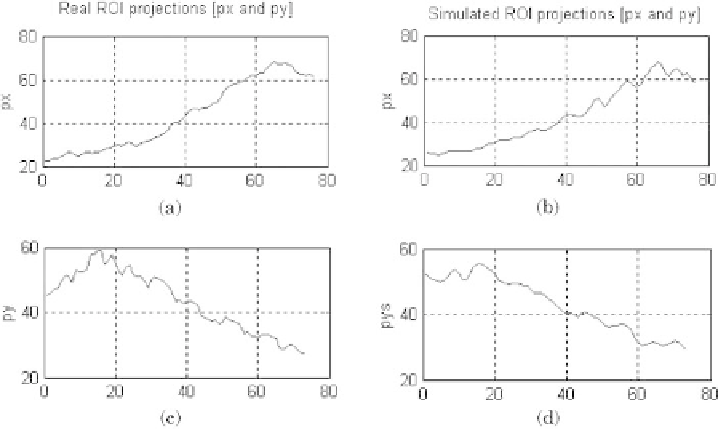
Figure 1.36: Horizontal ((a) and (b)) and vertical ((c) and (d)) projections of
(Fig. 1.35(a)) and simulated (Fig. 1.35(b)) ROIs IVUS images.
1.6.5 Polar Images
A polar representation of IVUS images offers several advantages: (1) The ROIs
to study are very easy to select, (2) we can compare the artifact generated by the
smoothing procedures, (3) radial and angular comparisons are totally separated,
therefore the transition zones in each direction are very easy to observe. Fig-
ure 1.38 shows real (a) and simulated (c) Cartesian IVUS images and the corre-
sponding real (b) and simulated (d) polar transformations. An ROI was selected
(a)
(b)
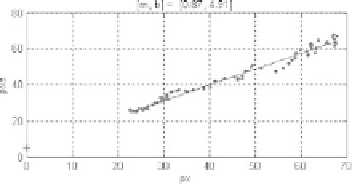
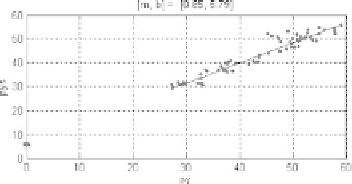
Figure 1.37:
Gray-level average correlation, horizontal simulated (pxs) versus
real projection (px), obtained from Fig. 1.36(a) versus (b), and vertical simulated
(pys) versus real (py) data, from Fig. 1.36(c) versus (d).