Biomedical Engineering Reference
In-Depth Information
(a)
(b)
(c)
(d)
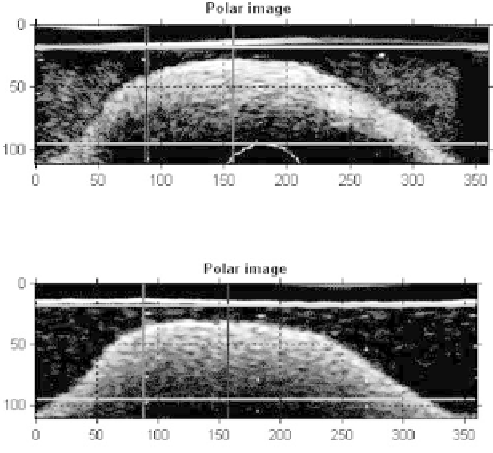
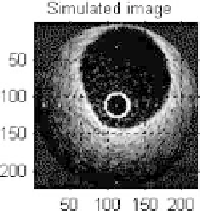
Figure 1.38:
Real (a) and simulated (c) Cartesian images and their correspond-
ing real (b) and simulated (d) polar transformation.
from the real and simulated polar images and the correlation coefficients were
obtained. Figure 1.39(a) shows the gray-level average vertical projection for the
real and simulated ROIs data (delineated in red in Fig. 1.38). We can see that the
gray-level profiles of the transition of arterial structure in the lumen/intima, in-
tima/media, and media/adventitia are very well simulated, the linear correlation
coefficients being
m
=
0
.
93 and
b
=
1
.
61 (Fig. 1.39(b)). The
global horizontal
profile
of the polar images along the projection
θ
(Figs. 1.40(a) and (b)) gives
very important and comparative information about the real and simulated gray-
level average of arterial structures. The information that can be extracted is
relative to the global gray-level distribution. The histogram (Fig. 1.40(b)) of
gray-level differences between the horizontal profiles of real and simulated data
indicates a very good correspondence (mean
µ
=
8
.
5 and deviation
σ
=
10
.
2).
Figure 1.41(a) shows the global projection in the radial direction (the vertical
profile). We can see a very good correspondence between the gray-level shape
profiles (mean
µ
=
5
.
7 and deviation
σ
=
8
.
5). The histogram (Fig. 1.41(b)) of
gray-level difference confirms the good correlation between the real and simu-
lated IVUS data.