Biomedical Engineering Reference
In-Depth Information
(a)
(c)
(b)
(d)
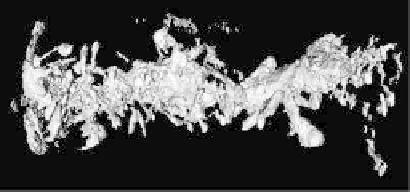
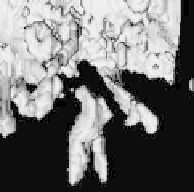
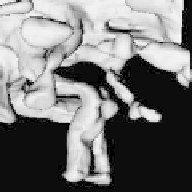
Figure 8.24: 3D results: (a) surface initialization, (b) final surface estimated
after 150 iterations, (c) a portion of the initial surface enlarged, and (d) the
corresponding portion in the final surface.
often fails to show up in the FBP reconstruction, does appear quite regularly in
hand-segmentations of the same datasets.
8.6.5.2 Sinogram Extrapolation
The fitting of surfaces to this data is a simplification. It is justified in the context
of segmentation, but there
are
underlying inhomogeneities in the density of
this specimen, which could be indicative of relevant structures. Thus for some
applications
direct
visualization of the measured data, by volume rendering,
offers advantages over the segmented surfaces. We propose to use the surface
estimation algorithm as a mechanism for estimating the missing data in the
sinograms.
Figures 8.25(a) and (b) show the input sinogram and the sinogram of the es-
timated model (for one slice) of the TEM dendrite data. The estimated sinogram
demonstrates that the surface estimation method recovers the missing infor-
mation in a reasonable way. Thus, we combine the sinograms from the model
with original sinograms to produce a “full” sinogram that still contains
all
of the