Biomedical Engineering Reference
In-Depth Information
(a)
(b)
(c)
(d)
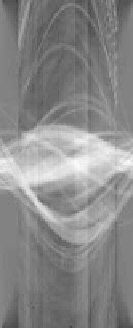
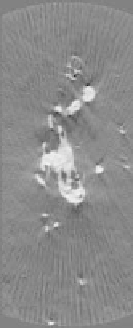
Figure 8.25:
Sinogram extrapolation for slice number 150 of dendrite data: (a)
input sinogram, (b) sinogram estimated by the proposed method, (c) augmented
sinogram constructed using original data and estimating missing data from the
segmentation, and (d) FBP reconstruction of the augmented sinogram.
orginal, measured data. FBP reconstructions from such augmented sinograms
should have fewer limited-angle streak artifacts.
We demonstrate this by comparing volume renderings with and without the
augmentation. We create augmented sinograms by using sinogram data from the
estimated model only where the data is missing from the measured sinograms.
The augmented sinogram for a single slice is shown in Fig. 8.25(c). The slice
reconstructed (FBP) from the augmented sinogram is shown in Fig. 8.25(d).
Note that this reconstructed slice does not contain the limited-angle artifacts
that appear in the slice in Fig. 8.23(c). Maximum intensity projection (MIP) vol-
ume renderings of the volume created from original sinograms and the volume
created from augmented sinograms are compared in Fig. 8.26. The main body
of the dendrite, which exhibited a very convoluted and fuzzy boundary, shows
better definition. Also, several of the spines which were dangling in the original
reconstruction are now connected.
8.7 Conclusions
This chapter has described a level set segmentation framework and the pre-
processing and data analysis techniques needed for a number of segmentation