Biology Reference
In-Depth Information
meadow where the leatherjackets are
abundant it starts to load up with food.
The first couple of leatherjackets are
found quickly and easily but, because of
the encumbrance of the prey in its
beak, the bird takes longer and longer
to find each successive prey. The result
is a 'loading curve' (or 'gain curve' as it
is sometimes called) that rises steeply
at first but then flattens off. This is a
curve of diminishing returns and the
starling's problem is when to give up. If
it gives up too early it spends a lot of
time travelling for a small load; if it
struggles on too long it spends time in
ineffective search which could be better
spent by going home to dump its load
and starting again at the beginning of
the loading curve. Somewhere in
between these extremes is the starling's
'best' option. A reasonable hypothesis
(but at the moment it is no more than
this), is that for the starling 'best' means
'providing the maximum net rate of
delivery of food to the chicks'. Any
starling that is slightly better at
producing chicks than its rivals will be
at a selective advantage, so selection
should in the long run favour behaviour
that maximizes chick production.
The best load can be found by drawing the tangent AB in Fig. 3.2a. The slope of
this line is (load/[travel time + foraging time]) or in other words rate of delivery of
food; this can be seen by the fact that it forms the hypotenuse of a right angled
triangle with a base measured in 'time' and a vertical corresponding to 'load'. Travel
time and the loading curve are constraints - fixed properties of the environment (or,
more precisely, of the interaction between the starling and its environment), and the
line AB gives the maximum slope, hence the maximum rate of delivery of food. Any
other line you could draw from A to the loading curve will have a shallower slope
(that is, give a lower rate of delivery) than the line AB. A couple of examples are
shown in Fig. 3.2a.
Figure 3.2b develops the argument a little further. Suppose that the starling now
switches to feeding at a closer site with a short travel time; how should its load per trip
change? Using the same method as before, we can now draw two lines (Fig. 3.2b): when
the travel time is shorter, the load that maximizes rate is smaller. One way to think of
this is to imagine the starling at its moment of decision to go home. If it goes it loses the
opportunity to continue foraging, if it stays it loses the opportunity to go home and start
afresh. When it is far away the expected returns from going home are relatively low,
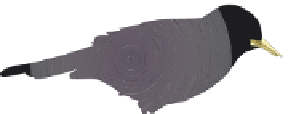
Fig. 3.1
Starlings fly from their nest to
a feeding site, search for a beak-full of
leatherjackets by probing in the grass,
then take them home to the nestlings.
The question examined in the first part
of this chapter is how many items the
parent should bring on each trip in order
to maximize the rate of delivery of food
to the nestlings.
Optimal load size
in starlings:
diminishing
returns


