Biology Reference
In-Depth Information
(a)
(b)
Load
Load
7 prey
B
8
8 prey
(Optimum)
7
Optimum (long) b´
6
5
Optimum (short) b
4
3
2
1 prey
1
A
Optimum
time
Long
Short
Travel time
Searching time
Travelling time
Searching time
(c)
7
6
5
4
3
Solid line: prediction
Dots: observed
2
1
0
0 10 20
30
40
50
60
70
80
90
100
Round trip times
Fig. 3.2
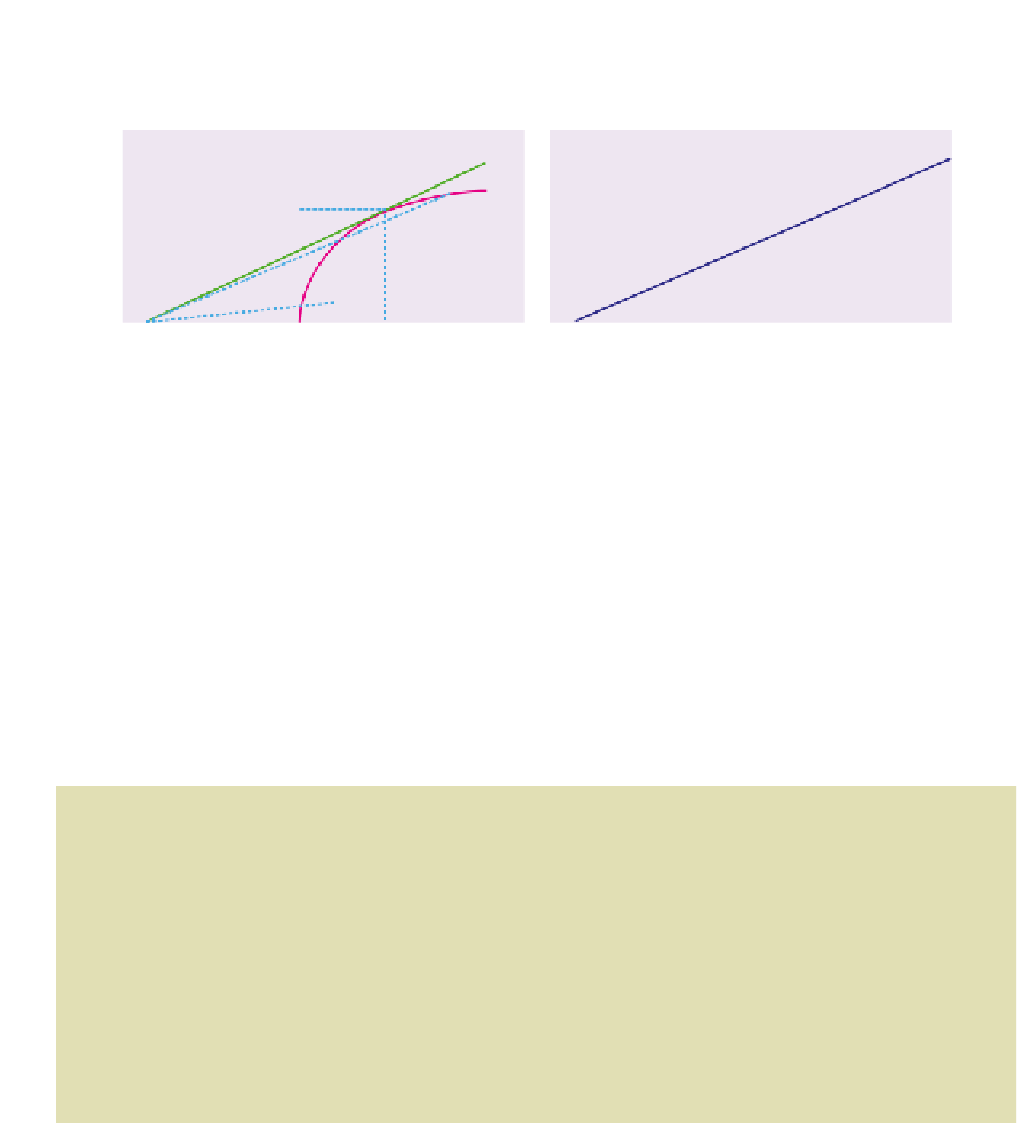
(a) The starling's problem of load size. The horizontal axis shows 'time' and the vertical axis shows 'load'.
The curve represents the cumulative number of leatherjackets found as a function of time spent searching. The
line AB represents the starling's maximum rate of delivery of food to the nestlings. This rate is achieved by taking a
load of seven leatherjackets on each trip. Two other lines, corresponding to loads bigger (eight) and smaller (one)
than seven, are shown to make the point that these loads result in lower rates of delivery (shallower slopes). Note
that although the cumulative load is shown here as a smooth curve, in reality it is a stepped line since each food
item is a discrete package. (b) When the round trip travel time is increased from short to long the load size that
maximizes delivery rate increases from b to b
. (c) When starlings were trained to collect mealworms from a feeder,
they brought bigger loads from greater distances. Each dot is the mean of a large number of observations of loads
brought from a particular distance. The predicted line goes up in steps because the bird is predicted to change its
load size in steps of one worm (of course the mean loads do not have to be integers). The prediction shown here
is one based on the model of Fig. 3.2b, but it also includes the refinement of taking into account the energetic
costs to the parent of foraging and to the chicks of begging. From Kacelnik (1984).
′
since there is a long way to fly before the next chance to forage. It therefore pays to
persist a little longer on the present trip, until current gains drop to a slightly lower level.
Alex Kacelnik (1984) tested this prediction of the model of load size in the following
way. He trained parent starlings in the field to collect mealworms for their young from a
wooden tray onto which he could drop mealworms through a long piece of plastic pipe.
Rather than letting the birds generate their own loading curve by diminishing search
The model
predicts smaller
loads with shorter
travel times