Civil Engineering Reference
In-Depth Information
Non-constant current density (NCCD) testing that mapped the material flow stress
for EAF. The model is shown in Eq. (
4.11
).
σ
predicted
=
K
′
ε
n
ε
m
exp
−(ε −
c
)
B
A
(4.11)
where
σ
predicted
is the predicted flow stress with the application of electricity,
K
′ is
the strength coefficient,
ε
is the strain,
n
is the strain hardening exponent,
ε
is the
strain rate,
m
is the strain rate sensitivity exponent,
is the current density, and
A
,
B
, and
C
are material specific constants for this model.
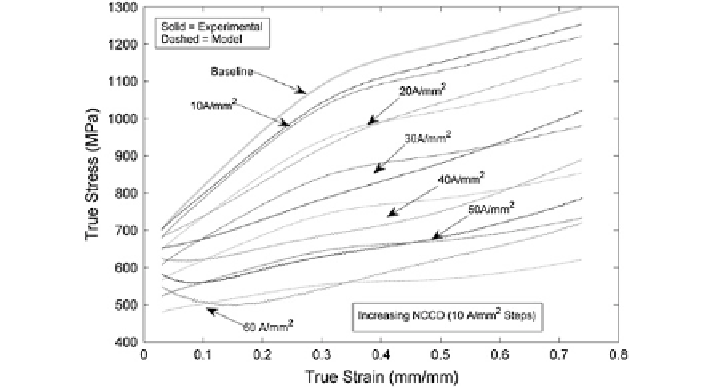
Using this model, the NCCD tests were fit using the stress predictor equation
to examine the relationship for 304 Stainless Steel and Grade 5 titanium. The
material specific constants were determined using least squares regression and
are shown in Table
4.4
. The corresponding results for the 304 Stainless Steel and
Grade 5 titanium are shown in Figs.
4.26
and
4.27
, respectively. As shown, the
model was fairly accurate at predicting the flow stress behavior for both materi-
als. On average, the stainless steel experimental flow stress curves were averaged
or approximated using this flow stress predictor. When considering titanium, the
large reductions that were seen at higher current densities were fairly approxi-
mated, however, from a possible threshold effect that causes a non-linear increase
in the flow stress reductions, the lower current density curves suffered in predict-
ability and were underestimated.
Table 4.4
NCCD model
constants
A
B
C
1.39
0.007869
−
0.1385
SS304
−
6
7.95
×
10
G5 titanium
3.83
0.00234
Fig. 4.26
SS304 NCCD empirical modeling