Civil Engineering Reference
In-Depth Information
0.6
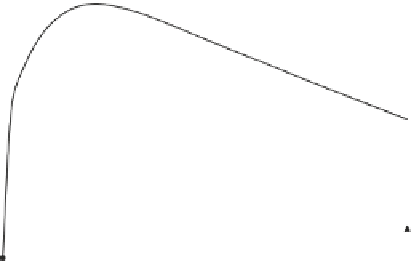
27.7A/mm^2
35.8A/mm^2
54.6A/mm^2
60.8A/mm^2
0.5
0.4
0.3
0.2
0.1
0
0
2
4
6
8
10
12
14
16
18
Time (s)
Fig. 4.3
Electroplastic effect coefficient (EEC) profiles [
3
]. The EEC profiles are shown, along
with a straight-line approximation
a time-based function is more suitable. To create an EEC profile as a function of
time, the same EEC profiles in Fig.
4.3
can be used, where a power law trend line
can be fitted to each profile as a function of the testing time.
4.1.3 Mechanical-Based EEC Conclusions
The mechanical approach examines power required for conventional tests and
EAF tests to produce the EEC. The EEC is time based and can be approximated
with a linear or power law function. Also of note, previous work has highlighted
a “threshold effect” whereby electrical application benefits are negligible until
a critical current density is reached [
2
]. Figure
4.3
supports this threshold effect
since the 60.8 A/mm
2
test has an EEC profile that is much higher than the other
three current densities. However, this does not mean that the electrical threshold is
60.8 A/mm
2
, but this was just one of the current densities tested. In this case, the
threshold is somewhere between 54.6 and 60.8 A/mm
2
.
4.2 Thermal-Based Approach to Determining the EEC
The objective of this section is to establish a methodology for quantifying the
EEC using thermal profiles. From the conservation of energy and empirical obser-
vations, an analytical model able to predict the temperature rise in the specimen
due to the electricity that was applied while subjected to deformation must be