Civil Engineering Reference
In-Depth Information
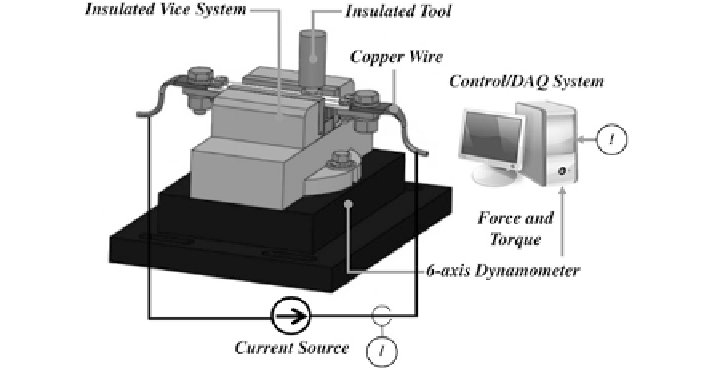
Fig. 11.31
Schematic diagram of the EAFSW experimental setup [
16
]
vertical milling machine using a drilling tool. The FSW tool rotating at 350 rpm is
manually fed downward during the plunging stage and locked when the shoulder
of the tool touches the top surface of the specimens. As soon as the shoulder of the
tool is in complete contact with the workpiece, current was allowed to flow through
the workpiece for the EAFSW tests. A dwell period of 5 s is used in both the con-
ventional FSW and EAFSW tests. The start of the dwell period is defined as when
the shoulder of the tool is in complete contact with the workpiece and the end of
dwell period is when the feed is stared. It should be noted that, for the EAFSW
tests, the start of the dwell period and the start of the current are at the same time.
In the EAFSW tests, the current was discontinued at the end of the feed.
Continuous DC current of 1,500 A, which results in a current density of
37.2 A/mm
2
, is passed through the workpiece for the EAFSW tests. A program in
LabVIEW software was developed to monitor the flow of current into the work-
piece. Both the conventional FSW and EAFSW tests were performed in a random
order and replicated three times to ensure consistency of the results.
11.3.3 Results and Discussion
The data collected using the force dynamometer are analyzed by plotting of the
feed force and torque with respect to time. The results are filtered with a mov-
ing average of 1,000 data points, and the results from the same type of tests
(conventional FSW or EAFSW) are averaged to obtain a single process curve
(three tests per test type). In the following sections, the process curve of con-
ventional FSW is compared to EAFSW through the use of the process feed,
force, and torque.