Civil Engineering Reference
In-Depth Information
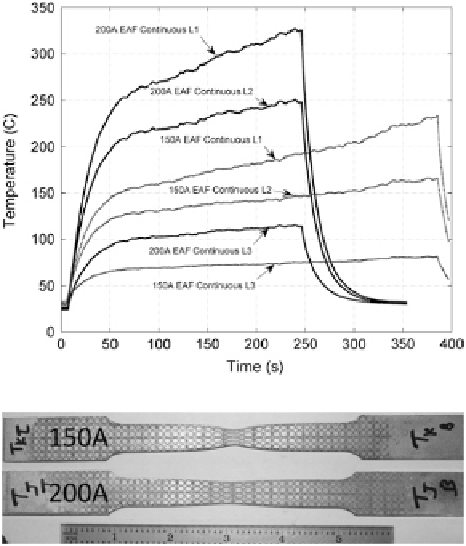
Fig. 8.29
Temperature
response for continuous
current application at
L1, L2, and L3
Fig. 8.30
Continuous EAF
tensile specimens tested at
150 and 200 A
occurred during forming at L1. This is a result of the higher temperature and addi-
tional strain which increases the internal energy of the lattice. Recrystallization is
a process where strain-free grains are nucleated and grain growth continues until
the boundaries are impinged. The orientation 1 micrograph at L1 is suggestive of
dynamic recrystallization due to a large quantity of smaller grains surrounded by a
few coarse grains.
For orientation 2 of the 150 A test, similar results are seen for the three loca-
tions. Again, L3 (Fig. C.19) and L2 (Fig. C.20) have larger grains with a small
amount of deformation, whereas L1 (Fig. C.21) displays a recrystallized structure.
From the statistical analysis, this is shown where Sample 11's average grain size
is different from Sample 12 and Sample 13. The average grain size of Sample 13
(L3) and Sample 12 (L2) in orientation 2 is 6.16 µm with a standard deviation of
2.02 µm and 6.00 µm with a standard deviation of 2.31 µm, respectively. In com-
parison, Sample 11 (L1) in orientation 2 has an average grain size of 4.18 µm with
a standard deviation of 1.29 µm.
Since this micrograph orientation depicts the microstructure along the deforma-
tion axis, a non-recrystallized structure would be extremely elongated in this axis
(e.g, Fig. C.18). However, this is not the case and the grain structure is refined.
The micrographs are presented for the 200 A continuous test (Fig. B.13 of
Appendix B) in orientation 1 at L3 to L1 in Figs. C.22, C.23 and C.24, respec-
tively. The average grain size for Sample 8 (L3) and Sample 7 (L2) in orienta-
tion 1 is 5.65 µm with a standard deviation of 1.89 and 5.84 µm with a standard