Civil Engineering Reference
In-Depth Information
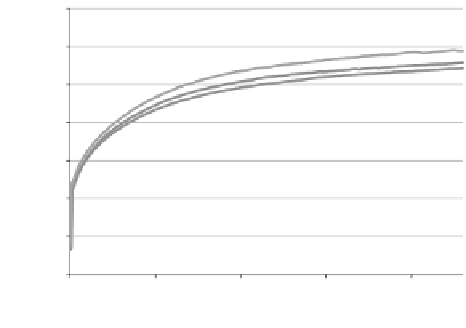
Fig. 8.2
Thermal profiles of
stationary electrical tests run
at CD
=
15 A/mm
2
[
5
]. There
was no significant difference
in the thermal profiles of
the stationary electrical tests
run on the different heat
treatments
350
27.20µm
15.08µm
21.99µm
300
250
200
150
100
50
0
0
5
10
15
20
Time (s)
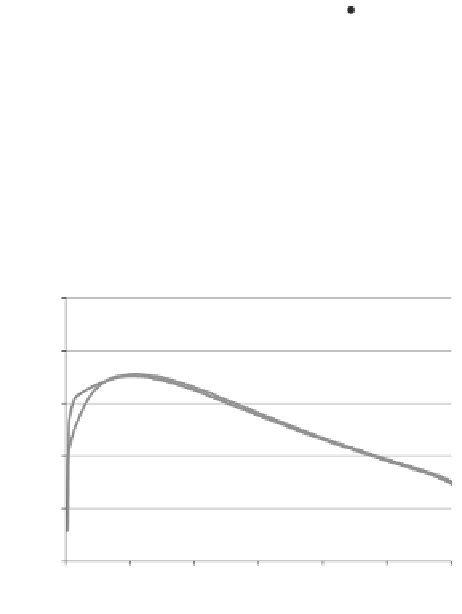
Fig. 8.3
Thermal profiles of
EAF tests run at CD
=
15 A/
mm
2
[
5
]. As was the case
with the stationary electrical
thermal profiles, there is no
significant difference in the
EAF thermal profiles as well
250
200
27.20µm
150
15.08µm, 21.99µm
100
50
0
0
5
10
15
20
25
30
Time (s)
Fig. 8.4
True stress-strain
profiles for conventional
compression tests [
5
]. When
testing the different heat-
treated specimens under
conventional compression,
there was no difference in the
conventional compression
stress-strain profiles
1400
1200
1000
800
15.08 m, 21.99m,
and 27.20 m
µ
µ
µ
600
400
200
0
0
0.2
0.4
0.6
0.8
1
1.2
True Strain
Figure
8.4
displays the true stress-strain profiles of all the parts during a con-
ventional compression test at a deformation speed of 0.5 in/min. The stress-strain
curves are identical, regardless of the grain size.