Civil Engineering Reference
In-Depth Information
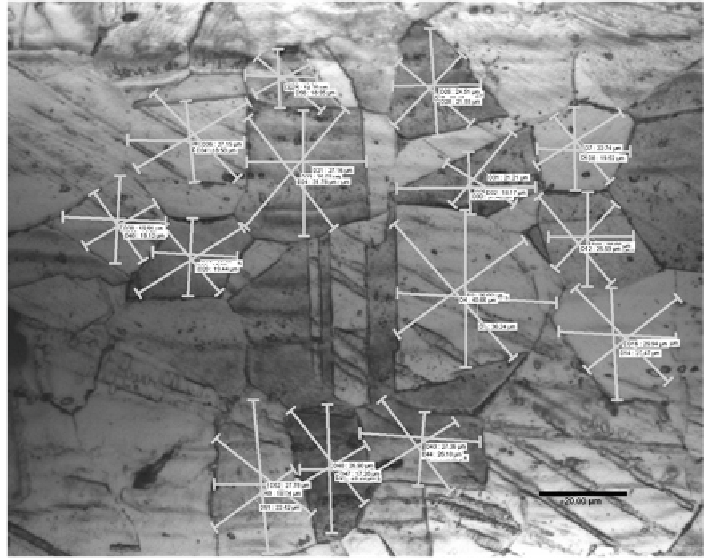
Fig. 8.1
Example of the four-measurement method for determining the average grain size [
5
].
Each complete grain in the micrograph was measured at four different angles (0°, 45°, 90°, and
135°) to account for any differences in grain orientation
8.1.2 Experimental Grain Size Testing
The following results present the testing performed on the stainless steel sam-
ples with the different grain sizes produced from the heat treatments. Figure
8.2
shows the thermal profiles of stationary electrical tests run at a current density of
15 A/mm
2
at a static load of 2,700 N for the three parts. Two replicates were run
for each grain size, and the replicates were consistent for each respective grain
size. The figure shows that the largest grain size has a thermal profile consistently
higher than the other two grain sizes (about 15 °C hotter at the end of the test).
This is uncharacteristic, because it was expected that the specimen with the small-
est grain size would have the hottest temperature profile because there would be
more localized scattering at grain boundaries. However, the difference between the
three grain sizes is minimal.
Figure
8.3
shows the thermal profiles for EAF tests run at a starting current
density of 15 A/mm
2
and a deformation speed of 0.5 in/min. As was the case with
the stationary electrical tests in the prior figure, the specimens with the largest
grain size had the highest temperature response (again, about 15 °C hotter at its
maximum temperature).