Civil Engineering Reference
In-Depth Information
experimental result. The model extends past the fracture point of the experimental
result as the model does not incorporate any failure criteria that would indicate
that the point at which the material will fail.
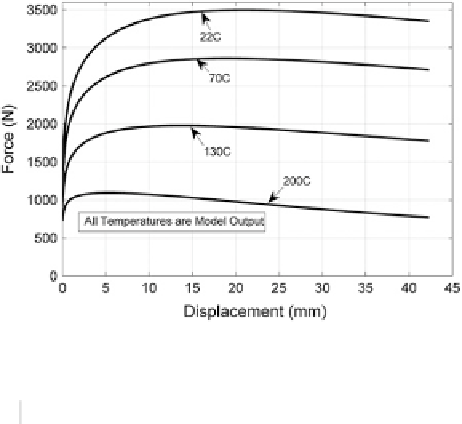
6.2.3.3 Results at Elevated Temperatures
The results from additional simulations are provided in Fig.
6.26
where the force
is proved as a function of total imposed displacement. As seen, the model predicts
the required forming force to decrease with increasing temperature.
Additionally, the prediction of instability was calculated using Eq. (
6.82
), and
the results are provided in Table
6.5
. As seen, the model results from the simula-
tion were capable of predicting the instability point (i.e., maximum force) for each
temperature simulated.
Figure
6.27
compares the elevated temperature responses (i.e., 200 and 250 °C)
from the model to the actual experimental data. As shown, the model accurately pre-
dicts the response until greater strains (>0.3) are reached. This deviation is a result
of severe non-uniform elongation in the gauge region of the experimental test. This
non-uniform elongation is where the material begins to fail, and as a result of the
model not incorporating any failure criteria, this response is not modeled.
Thus, this section shows the ability of the model to predict the strain in
each element and the required force to deform all of the elements at varying
Fig. 6.26
Force results plot
for a uniform temperature
input of 22, 70, 130 and
200 °C
Table 6.5
Summary of instability strain and displacement predictions
22 °C
70 °C
130 °C
200 °C
Strain hardening exponent (n)
0.1818
0.1654
0.1436
0.0913
Softening coefficient (s)
0
0
−
0.1728
−
0.8238
0.1818
0.1654
0.12244
0.05006
Instability strain (mm/mm)
Instability displacement (mm)
20.93
18.89
13.68
5.39